Screening of the microelements composition of drinking well water ofTranscarpathian region, Ukraine
- ediensofficial
- 27 жовт.
- Читати 14 хв

Підписуйтесь на наші соціальні мережі, щоб стежити за останніми новинами тут 💜:
Сайт: www.ediens.me
LinkedIn: www.linkedin.com/ediens
Instagram: www.instagram.com/ediens_official
TikTok: www.tiktok.com/@ediens_official
Sergii Sukhareva ssukharev@ukr.net ∙ Larysa Bugynab ∙ Oleksandra Pallah (Sarvash)c,d ∙ Tetiana Sukhareva (Riabukhina)e ∙ Volodymyr Drobnychf ∙ Kristina Yeremg
Abstract
Background
For Transcarpathian region, with a pronounced landscape diversity of territories and significant areas of nature reserves, well water is an important source of drinking water. Screening of the microelement composition of drinking well water in Transcarpathia has not been carried out before. The microelement composition of such well water can be considered as the natural (baseline) indicator of quality.
Methods
We screened of the microelement (Cu, Zn, Fe, P, Ca, Mg, Mn, Mo, Co, As, Se, I, Br and F) composition of drinking well water in Transcarpathian region (for all 13 districts). Standard methods were used to determination the concentration of chemical elements in well water: electrothermal atomic absorption spectroscopy (Cu, Zn, Fe, Mn, Mo, Co), flame photometry (Ca, Mg), inverse voltammetry (total iodine), potentiometry (F, Br), fluorimetric (Se) and spectrophotometric methods (P, As).
Results
The content of chemical elements in well water varies over a wide range, in particular for Cu: 3.27–11.6 μg⋅L−1, Zn: 8.16–38.2 μg⋅L−1; Fe: 37.9–411 μg⋅L−1; P: 51.4–193 μg⋅L−1; Ca: 85–139 mg⋅L−1, Mg: 10.2–18.9 mg⋅L−1, Mn: 22.8–78.1 μg⋅L−1; Mo: 2.33–8.96 μg⋅L−1; Co: 1.72–3.38 μg⋅L−1; As: 2.9–17.4 μg⋅L−1; Se: 0.95–3.6 μg⋅L−1; I: 0.94–4.4 μg⋅L−1; Br: 712–3098 μg⋅L−1; F: 71–149 μg⋅L−1. The tendency that the content of microelements (Cu, Zn, Mn, Mo, Co, As, Se, I, Br, and F) in well waters of different landscape zones was evaluated through Spearman's coefficients. The content of trace elements in the waters of different landscape zones increases in the series: lowland landscape > foothill landscape > mountainous landscape (Spearman's coefficients: Cu – 0.62, Zn – 0.85, Mn – 0.69, Mo – 0.83, Co – 0.79, P – 0.74, As – 0.72, Se – 0.75, I – 0.80, Br – 0.91, F – 0.73).
Conclusion
It is shown that the chemical composition of well water can be considered as the natural (baseline) indicator of quality of groundwater in Transcarpathia, taking into account topographic and geochemical features of the territories. Among the main problems of drinking well water in Transcarpathia are the relatively high content of Fe (typical for different landscape zones), as well as the low content of Se, I and F. The correlation of inter-elements content of chemical elements in drinking well waters of Transcarpathia has been revealed. The most pronounced correlations are observed for such pairs of microelements: Co–Mo (r > 0.95), I–Br (r > 0.92), Zn–Br (r > 0.89), Cu–Co (r > 0.84), Se–Co (r > 0.84), Mo–P (r > 0.84), Mo–I (r > 0.82) and Zn–Mo (r > 0.80).
Keywords
1 Introduction
Water is the foundation of life and an indispensable natural resource. Potable fresh water has particular value. Unfortunately, a significant number of people in the world do not have access to good quality and safe drinking water. The quality of drinking water, whether surface or groundwater, has a significant impact on the human health [1, 2, 3]. Therefore, a number of works are devoted to assessing the risk for human health from the quality of drinking water [4, 5, 6]. In general, monitoring of the quality of waters, including drinking waters, is an urgent task [7, 8, 9]. Programs and monitoring systems are developed [10, 11, 12, 13].
In a number of countries around the world, well waters, which can be sensitive to pollution of both of natural and anthropogenic origin, play an important role as sources of drinking water [14]. Assessment of the quality of well and groundwaters suitable for drinking or other purposes is carried out in several countries of the world [15, 16, 17, 18], especially if they have significant sources of pollution. In most cases, the quality assessment and monitoring of drinking well water is carried out according to standard physicochemical or microbiological parameters [19, 20], but drinking water is an important source of microelements for humans. The microelement composition of drinking well water in Transcarpathia has not been assessed previously, while more than half of the region's population use well water as a source of drinking water. Such assessment is relevant for several reasons. Firstly, Transcarpathia has a pronounced geological and geochemical diversity (elevation difference from 100 m to 2100 m), more than half of the region belongs to mountainous or foothill areas. Moreover, within one district, the elevation difference can exceed 1 km. Secondly, the young Carpathian Mountains have high tectonic and geological activity, which can affect the microelement composition of groundwater. About half of the area of the region is covered by forests, more than 13% is the territory of the nature reserve zone, so the microelement composition of groundwater can reflect the geochemistry of different regions (natural quality). Thirdly, the aquifers of Transcarpathia are unprotected and only about 20% are relatively protected.
In this study there are presented the results of screening of the microelement composition of well drinking water of Transcarpathia for 14 chemical elements (total content), which play an important role in human life. The study covered all areas of the region taking into account the topographic and geochemical features of the territories.
2 Materials and methods
2.1 Sampling and sample preparation
The study was carried out in the summer of 2018. Samples of drinking well water were taken from a depth of 4–10 m, depending of the source. Within each district, 10 samples of well water by volume of 1.0 L were taken, taking into account the area of the district, topographic and geochemical conditions. The sample was averaged proportionally. Well water parameters were determined in the same day in the laboratory without preservation of the sample. The location of the research areas taking into account the landscape diversity is shown in Figure 1. The study was carried out in three landscape areas: mountainous area (3 districts: Rakhiv, Mizhhirya and Vokjvets), foothill area (6 districts: Svaliava, Tiachiv, Velykyi Bereznyi, Perechyn, Irshava and Khust) and lowland area (4 districts: Uzhhorod, Mukachevo, Beregove and Vynogradiv).

Figure 1 shows that the studied lowland areas (Uzhhorod, Mukachevo, Berehove and Vynohradiv districts) are located within the Transcarpathian deflection. The foothill territories (Perechyn, Velykyi Bereznyi, Svaliava, Irshava, Khust and Tiachiv districts) are located in different territories and cover the Volcanic Carpathians, Marmara massif, outer flysch areas and partially inner covers and rock zones. Mountain areas (Rakhiv, Mizhhirya and Volovets districts) are located on the outer flysch areas (Krosno Zone) and the inner covers and rock zones.
To compare the results, we used bottled drinking water of natural origin (Transcarpathian region).
2.2 Geology of Transcarpathian region
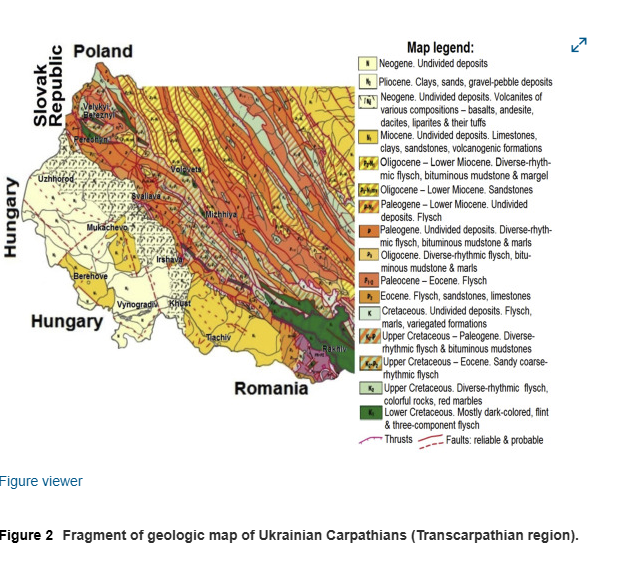
Detailed information on the geology of the Transcarpathian region (including the studied territories) is represented in the work [21]. Figure 2 presents a fragment of the Ukrainian Carpathians (Transcarpathian region) geological map. It can be seen that the geology of the studied areas is complex and is represented mainly by Cenozoic sediments and, to a lesser extent, by Mesozoic sediments.
Brief geological description of the studied territories (Figure 2):
Uzhhorod district (lowland territory): Pliocene and Neogene;
Mukachevo district (lowland territory): Pliocene, Neogene and Miocene;
Berehove district (lowland territory): Pliocene and Miocene;
Vynohradiv district (lowland territory): Pliocene;
Perechyn district (foothills): Paleogene, Oligocene and fragmentary Paleocene-Eocene and Lower Cretaceous;
Velykyi Bereznyi district (foothills): complex combination of Paleogene, Upper Cretaceous-Eocene, Lower Cretaceous, Upper Cretaceous and Oligocene-Lower Miocene;
Svaliava district (foothills): complex combination of Paleogene, Oligocene-Lower Miocene, Upper Cretaceous-Paleogene and Lower Cretaceous;
Irshava district (foothills): complex combination of Neogene, Miocene and Upper Cretaceous-Eocene;
Tiachiv district (foothills): mainly Miocene with elements of Eocene and Upper Cretaceous;
Khust district (foothills): relatively uniform combination of Miocene, Pliocene and Neogene;
Volovets district (mountainous area): a complex combination of Oligocene-Lower, Upper Cretaceous Eocene, Paleogene and Paleocene-Eocene;
Mizhhirya district (mountainous area): Paleogene, Paleocene-Eocene with elements of the Oligocene-Lower and Cretaceous;
Rakhiv district (mountainous area): a complex combination of Lower Cretaceous, Upper Cretaceous-Eocene, Cretaceous and Upper Cretaceous.
2.3 Analytical methods and instruments
All chemicals used were analytical grade, and double-distilled water used throughout the work. Standard methods were used to determination the concentration of chemical elements in well water [22]. Electrothermal atomic absorption spectroscopy (graphite furnace) was used to determine Cu, Zn, Fe, Mn, Mo, and Co (λ, nm: Cu – 324.8, Zn – 213.9, Fe – 248.3, Mn – 279.5, Mo – 313.3, Co – 240.7). Studies were performed on AAS vario® 6 (Analytik Jena AG, Germany). As a chemical modifier used Pd(NO3)2 ("Suprapur®", Merck, Germany). Determination of Ca and Mg content was carried out by flame photometry (λ: Ca – 423 nm, Mg – 385 nm, FPA-2-01, LLC Labtime, Russia). The total iodine content was determined by inverse voltammetry (complex Ecotest-VA-iodine, Russia). The determination of F and Br was carried out by potentiometric method (SevenCompact S220, Mettler Toledo, USA), Se – by fluorimetry method (λabs = 378 nm, λem = 520 nm, Hitachi F-7000, Hitachi Ltd., Japan). The P and As contents were determined by spectrophotometric method (Shimadzu UV-2600, Shimadzu Co., Japan).
2.4 Statistics and mapping
This used standard statistical methods, such as the Pearson's and Spearman's correlation coefficients in the software SPSS Statistics (IBM) and OriginPro (OriginLab Corporation).
The program ArcGIS 10.2.1 [23] was used to map the territory of Transcarpathian based on the results of screening the microelement composition of well drinking water.
3 Results and discussion
The results of determination of the microelements of drinking well water are presented in Tables 1, 2, and 3. The results of the study show that drinking well water in Transcarpathia is relatively rich in microelements. The microelement composition of well waters in Transcarpathia can be considered as a natural (baseline) indicator of quality. The gradation of the content of microelements in drinking well water in different landscape zones is obviously due to the geochemical features of the territories.


Compared with bottled drinking water, Transcarpathian well drinking water is richer in microelements.
The Fe content in the investigated drinking well water ranges from 37.9 – 411 μg⋅L−1. In individual water samples, the Fe content exceeds the recommendations [24], therefore, iron should be removed before drinking this water. Relatively high Fe content in well water is characteristic of all landscape zones of Transcarpathia (Figure 3). We can see that no pronounced pattern of distribution of Fe in well drinking water for different landscape areas of Transcarpathia is observed. So, a relatively high Fe content is observed in the well water of the Mizhhiryi district (mountainous area), within the Velykyi Bereznyi and Perechyn districts (foothill area), as well as in the Vynogradiv district (lowland area). It should be noted that the problem of high content of Fe in surface and groundwaters is typical for Transcarpathia. In surface and underground water sources the content of Fe can reach up to 6–8 mg⋅L−1.

In the drinking well waters of Transcarpathia, a relatively high content of Cu and Zn is observed, which is typical for copper-zinc geochemical provinces. The Cu content in well water varies between3.27 – 11.6 μg⋅L−1, and Zn – between 8.16 – 38.2 μg⋅L−1. These indicators comply with drinking water quality standards. For Cu and Zn, a pronounced trand of their distribution in well water of different landscape areas is shown, which can be observed for Zinc (Figure 4). It can be seen that the well water of the mountainous area contains less Zn than the water of foothill areas and, accordingly, lowlands area. So, the average Zn content in the well waters of the mountainous area is 9.36 μg⋅L−1, in the waters of the foothill area - 18.6 μg⋅L−1, and in the waters of the lowlands area - 31.6 μg⋅L−1 (Table 1). Average Cu content in well waters of the mountainous area is 4.82 μg⋅L−1, in the waters of the foothill area - 8.47 μg⋅L−1, and in the waters of the lowlands area - 9.21 μg⋅L−1 (Table 1).

The patterns of the distribution of microelements in drinking well water, which are observed for Cu and Zn, are characteristic of most chemical elements (Mn, Mo, Co, As, Se, I, Br, and F), except Fe, Ca and Mg. So, the content of Mn in well water is quite high and varies within 22.8–78.1 μg⋅L−1. At the same time, in the well waters of Transcarpathia the relatively low content of Se (0.95–3.6 μg⋅L−1), Iodine (0.94–4.4 μg⋅L−1) and Fluorine (71–149 μg⋅L−1) is observed. The problem of iodine and fluorine deficiency is typical for Transcarpathia [25], especially for mountainous landscape area. Trends in the content of trace elements in well waters in different landscape areas were estimated using Spearman's coefficients.
The content of trace elements in the waters of different landscape zones increases in the series: lowland area > foothill area > mountainous area (Spearman's coefficients: Cu – 0.62, Zn – 0.85, Mn – 0.69, Mo – 0.83, Co – 0.79, P – 0.74, As – 0.72, Se – 0.75, I – 0.80, Br – 0.91, F – 0.73).
The content of Calcium and Magnesium in the well waters of Transcarpathia is quite high (Ca: 85–139 mg⋅L−1, Mg: 9.7–18.9 mg⋅L−1), however, there is no pronounced regularity of their content for different landscape areas. The ratio of Calcium to Magnesium (Ca/Mg) in the well waters of Transcarpathia also does not have a pronounced regularity (Figure 5), which is obviously due to the geochemical features of the territories.

We have carried out work to assess the correlation patterns of the interelement composition of drinking well water. The calculation results are presented in the form of a “thermal” diagram (Figure 6). As we can see from the data in the figure, positive correlations observed for all trace elements. The most pronounced correlations observed for such pairs of trace elements: Co–Mo (r > 0.95), I–Br (r > 0.92), Zn–Br (r > 0.89), Cu–Co (r > 0.84), Se–Co (r > 0.84), Mo–P (r > 0.84), Mo–I (r > 0.82) и Zn–Mo (r > 0.80). For Calcium and Magnesium, there is practically no correlation with respect to other microelements. More detailed results of the calculation of interelement correlation patterns are presented in Table 4. The established patterns allow the prediction of trends in the possible content of certain microelements in drinking well water based on the data of content of other microelements. This will increase the objectivity of screening and monitoring of well water in Transcarpathia.


4 Conclusion
Based on the screening of the microelement composition (14 chemical elements) of drinking well water in Transcarpathia, patterns of the distribution of chemical elements in waters of different landscape areas were established. It is shown that the chemical composition of well water can be considered as the natural (baseline) indicator of quality of groundwater in Transcarpathia, taking into account topographic and geochemical features of the territories. The content of most microelements (Cu, Zn, Mn, Mo, Co, As, Se, I, Br, and F) in the well waters of mountainous areas is much lower than in the waters of foothill and lowland areas. Several problems of drinking well water in Transcarpathia have been identified. Firstly, it is a relatively high content of Fe in water (37.9–411 μg⋅L−1), which requires its removal before use. High iron content (>300 μg⋅L−1) is characteristic of waters of different landscape areas. Secondly, drinking well waters of Transcarpathian have low content of Se (0.95–3.6 μg⋅L−1), Iodine (0.94–4.4 μg⋅L−1) and Fluorine (71–149 μg⋅L−1). The problem of iodine and fluorine deficiency is typical for Transcarpathian, especially for mountain landscape zones. Correlations for the interelement content of chemical elements in the drinking well waters of Transcarpathia are found. The most pronounced correlations are observed for such pairs of trace elements: Co–Mo (r > 0.95), I–Br (r > 0.92), Zn–Br (r > 0.89), Cu–Co (r > 0.84), Se–Co (r > 0.84), Mo–P (r > 0.84), Mo–I (r > 0.82) и Zn–Mo (r > 0.80). This allows us to predict the content of some chemical elements in well water based on data on the content of other chemical elements, which will increase the objectivity of monitoring studies.
Declarations
Author contribution statement
Sergii Sukharev: Conceived and designed the experiments; Analyzed and interpreted the data; Wrote the paper.
Larysa Bugyna, Oleksandra Pallah (Sarvash): Performed the experiments; Contributed reagents, materials, analysis tools or data.
Tetiana Sukhareva (Riabukhina): Performed the experiments; Analyzed and interpreted the data.
Volodymyr Drobnych: Analyzed and interpreted the data; Wrote the paper.
Kristina Yerem: Contributed reagents, materials, analysis tools or data.
Funding statement
This work was supported by the Ministry of Education and Science of Ukraine, registration number 0117U000379.
Competing interest statement
The authors declare no conflict of interest.
Additional information
No additional information is available for this paper.
References
Edmunds, W.M. ∙ Smedley, P.L.
Geological Society, London, Special Publications, 1996 91-105
Jordana, S. ∙ Batista, E.
Natural groundwater quality and health
Geol. Acta. 2004; 2:175-188
Li, P. ∙ Li, X. ∙ Meng, X. ...
Appraising groundwater quality and health risks from contamination in a semiarid region of northwest China
Expo. Health. 2016; 8:361-379
Havelaar, A.H. ∙ Melse, J.M.
Quantifying Public Health Risks in the WHO Guidelines for Drinking-Water Quality: A Burden of Disease Approach
Report 734301022/2003 RIVM, Bilthoven, Netherlands, 2003
Zhu, L. ∙ Yang, M. ∙ Chen, X. ...
2019. Health risk assessment and risk control: drinking groundwater in yinchuan plain, China
Expo. Health. 2019; 11:59-72
Cengiz, M.F. ∙ Kilic, S. ∙ Yalcin, F. ...
Evaluation of heavy metal risk potential in Bogacayi River water (Antalya, Turkey)
Environ. Monit. Assess. 2017; 189:248
Edmunds, W.M. ∙ Shanda, P. ∙ Hartb, P. ...
The natural (baseline) quality of groundwater: a UK pilot study
Sci. Total Environ. 2003; 310:25-35
Storey, M.V. ∙ der Gaag, B. ∙ Burns, B.P.
Advances in on-line drinking water quality monitoring and early warning systems
Water Res. 2011; 45:741-747
Subba Rao, N.
Seasonal variation of groundwater quality in a part of Guntur District, Andhra Pradesh, India
Environ. Geol. 2006; 49:413-429
Babiker, I.S. ∙ Mohamed, M.A.A. ∙ Hiyama, T.
Assessing groundwater quality using GIS
Water Resour. Manag. 2007; 21:699-715
Dahiya, S. ∙ Singh, B. ∙ Gaur, S. ...
Analysis of groundwater quality using fuzzy synthetic evaluation
J. Hazard Mater. 2007; 147:938-946
Nas, B. ∙ Berktay, A.
Groundwater quality mapping in urban groundwater using GIS
Environ. Monit. Assess. 2010; 160:215-227
Strobl, R.O. ∙ Robillard, P.D.
Network design for water quality monitoring of surface freshwaters: a review
J. Environ. Manag. 2008; 87:639-648
Li, P. ∙ Wu, J. ∙ Qian, H.
Hydrogeochemistry and quality assessment of shallow groundwater in the southern part of the Yellow River alluvial plain (Zhongwei section), China
Earth Sci. Res. J. 2014; 18:27-38
Li, P.
Groundwater quality in western China: challenges and paths forward for groundwater quality research in western China
Expo. Health. 2016; 8:305-310
Ramakrishnaiah, C.R. ∙ Sadashivaiah, C. ∙ Ranganna, G.
Assessment of water quality index for the groundwater in Tumkur Taluk, Karnataka State, India
J. Chem. 2009; 6:523-530
Richards, R.P. ∙ Baker, D.B. ∙ Creamer, N.L. ...
Well water quality, well vulnerability, and agricultural contamination in the midwestern United States
J. Environ. Qual. 1996; 25:389-402
Vasanthavigar, M. ∙ Srinivasamoorthy, K. ∙ Vijayaragavan, K. ...
Application of water quality index for groundwater quality assessment: thirumanimuttar sub-basin, Tamilnadu, India
Environ. Monit. Assess. 2010; 171:595-609
Liu, C.-W. ∙ Lin, K.-H. ∙ Kuo, Y.-M.
Application of factor analysis in the assessment of groundwater quality in a Blackfoot disease area in Taiwan
Sci. Total Environ. 2003; 313:77-89
Salehi, H. ∙ Zeinivand, H.
Evaluation and mapping of groundwater quality for rigation and drinking purposes in Kuhdasht region, Iran
Environ. Resour. Res. 2016; 4:75-79
Földvary, G.Z.
Geology of the Carpathian Region
World Scientific Publish Inc. Co., Pte. Ltd., Singapore – New Jersey – Hong Kong, 1988
APHA
Standard Methods for the Examination of Water and Wastewater
APHA-AWWA-WEF, Washington, D.C., 2005
Childs, C.
Interpolating surface in ArcGIS spatial analyst
ArcUser. 2004; 3:32-35
WHO
Guidelines for drinking water quality
World Health Organization, Geneva, in: Recommendations. 1. 2008
Kostenko, Y.Y. ∙ Melnyk, V.S. ∙ Horzov, L.F. ...
Prevalence of main dental diseases in children who live in conditions of biogeochemical fluorine and iodine deficiency
Dent. Res. J. 2019; 16:271-275


Коментарі