Personalized Nutrition for MicrobiotaCorrection and Metabolism Restorein Type 2 Diabetes Mellitus Patients
- ediensofficial
- 27 жовт.
- Читати 24 хв

Підписуйтесь на наші соціальні мережі, щоб стежити за останніми новинами тут 💜:
Сайт: www.ediens.me
LinkedIn: www.linkedin.com/ediens
Instagram: www.instagram.com/ediens_official
TikTok: www.tiktok.com/@ediens_official
Tamara Meleshko , Roman Rukavchuk , Olga Levchuk ,
and Nadiya Boyko
Abstract
Type 2 diabetes is one of the most common
noncommunicable diseases in the world.
Recent studies suggest a link between type
2 diabetes and microbiota, as well as the ability
to treat and prevent it using personalized
approaches to nutrition. In this work, we
conducted clinical studies on the effects of a
personalized diet on 56 female patients. Bio-
chemical, physical, and immunological
parameters were measured by standard
methods on days 1 and 18 of the experiment.
Gut and oral microbiota studies were
performed in dynamics on days 1, 7, 11, and
18 using real-time polymerase chain reaction.
With the help of the developed information
system, a personalized diet was developed for
each participant of the experiment. In the
group of patients following personalized diets
a statistically significant decreasing levels of
glucose, thymol test, creatinine, very low-
density lipoprotein, urea, secretory IgA, and
tumour necrosis factor-α, and improvement in
all physical parameters were observed. There
was a statistically significant increase in uric
acid, sodium, and magnesium. Statistically
significant changes in gut microbiota were
observed in Enterococcus faecalis,
Escherichia coli (lac+, lac), Lactobacillus
spp., and Candida spp. Such microorganisms
of oral microbiota as E. faecalis, Lactobacillus
spp., Pseudomonas aeruginosa, and Candida
spp. demonstrated statistically significant
changes. All these changes indicate an
improvement in the patients’ condition in the
experimental group compared to the control
group. Our algorithm used for the develop-
ment of personalized diets for patients with
diabetes type 2 demonstrated clinical efficacy
of its implementation.
Keywords
Human microbiota · Metabolism regulation ·
Noncommunicable disease · Personalised diet ·
Prognostic correction
1 Introduction
Type 2 diabetes mellitus (T2D) is a growing
global health problem closely related to the epi-
demic of obesity. It is characterized by
dysregulation of carbohydrate, lipid, and protein
metabolism and results from impaired insulin
secretion, insulin resistance, or a combination of
both (DeFronzo et al. 2015). T2D is one of the
noncommunicable diseases (NCDs) common
among almost all people in the world
(Raychaudhuri 2011) regardless of their age and
region due to the changes in lifestyles, genetics,
and environmental factors, all of which together
influence the disorder (Raj et al. 2018).
Typical clinical markers of type 2 diabetes
include glucose and glycosylated haemoglobin,
increased cholesterol, triglycerides, low-density
lipoprotein, very low-density lipoprotein, and
decreased high-density lipoprotein (Krauss
2004). Metabolic parameters such as urea, uric
acid, creatinine, bilirubin, calcium, magnesium,
sodium, alanine aminotransferase, and others
involved in lipid profile regulation are an addi-
tional source of complete information about the
biochemical status of the human body. Recent
researches have demonstrated that the develop-
ment of low-grade inflammation is a conse-
quence of gut microbiota alteration, which is
closely related to metabolic disorders such as
obesity and T2D (Cani et al. 2012; Minihane
et al. 2015). In particular, in the majority of
patients suffering from diabetes the levels of
Bifidobacterium and Lactobacillus decrease,
which leads to an increase in the levels of
Bacteroides, Prevotella, Peptococcus, Clostrid-
ium, Proteus, Staphylococcus, and Candida.
Importantly, T2D subjects have smaller amounts
of butyrate producing bacteria, such as
Roseburia intestinalis and Faecalibacterium
prausnitzii, and a mucus-degrading bacterium
Аkkermansia muciniphila (Tilg and Moschen
2014).
Studies conducted within the “Human
Microbiome” project (Group et al. 2009)
demonstrated that intestinal microbiome can be
dominated by different ratios of beneficial
microorganisms and still perform identical
functions. Thus, it is not only the species compo-
sition of the microbiome, but also its “function”
that is important. Herewith, it is obvious that the
microbiome of each individual is unique.
Recently, numerous research studies have
been conducted to find a relationship between
nutrition and its impact on human health. Never-
theless, today a balanced diet principle remains
practically unapplied. The reason is, on the one
hand, that people misunderstand (underestimate)
the role of food as a source of essential balanced
nutrients. On the other hand, there are huge
amounts of data on “proper nutrition” (rational
nutrition) available and they are often contradic-
tory, scientifically unsubstantiated, and clinically
unconfirmed. A new modern challenge is the use
of P4 (predictive, preventive, personalised, and
participatory) approaches, in particular
personalized nutrition, in medical practice.
The diet-microbiome interplay is currently the
basis for personalized nutrition introduction and
microbiota composition is the key factor affecting
responsiveness to nutritional interventions that
will soon take into account initial stratification
of individuals on the basis of microbiota (Ercolini
and Fogliano 2018).
The health benefits of adherence to the Medi-
terranean diet, as well as the relationship between
microbiota and its associated metabolome in peo-
ple consuming varied diets ranging from vegan to
omnivorous, are now evidence-based (Shanahan
et al. 2017).
In our opinion, the most promising way of
individual microbiome correction, as well as
prognostic modulation of local immune response,
is the use of complete personalized diets rather
than individual components. The most popular
diets whose positive health effects on the human
body are considered to be established include the
Mediterranean diet, vegetarian/vegan diet, high-
fibre diet, and high-protein diet.
The antioxidant and anti-inflammatory effects
of the Mediterranean diet on the whole as well as
the effects of this diet’s individual components, in
particular olive oil, fruits and vegetables, whole
grains, and fish, have a beneficial impact on
abdominal obesity, lipids levels, glucose metabo-
lism, and blood pressure levels (Kastorini et al.
T. Meleshko et al.
2011). Gut microbiota in individuals following
the Mediterranean diet is characterized by high
levels of Lactobacillus spp., Bifidobacterium
spp., and Prevotella spp. and low levels of Clos-
tridium spp., which relates to weight loss,
improvement of the lipid profile, and decreased
inflammation (Singh et al. 2017).
For vegetarians and vegans, the most relevant
risk factors for chronic disease, such as body
mass index (BMI), lipid variables, and fasting
glucose, are significantly lower. People following
a plant-based dietary pattern demonstrate signifi-
cantly lower levels of BMI, total cholesterol,
LDL-cholesterol, triglycerides, and blood glucose
when vegetarians were compared to
nonvegetarians, and lower levels of BMI, total
cholesterol, and LDL-cholesterol when vegans
were compared to nonvegans (Dinu et al. 2017).
People following vegan and vegetarian diets rich
in fermentable plant-based foods were reported to
have a microbiota characterized by a lower abun-
dance of Bacteroides spp. and Bifidobacterium
spp. (Wu et al. 2016).
High fibre intake is associated with lower serum
cholesterol concentrations, lower risk of coronary
heart disease, reduced blood pressure, enhanced
weight control, better glycaemic control, reduced
risk of certain forms of cancer, and improved
gastrointestinal function (Anderson et al. 2009).
One study revealed that three diets containing dif-
ferent fibre-rich whole grains (barley, brown rice,
or a combination of both) increased microbial
diversity, the Firmicutes/Bacteroidetes ratio, and
the abundance of the genus Blautia in faecal
samples (Oriach et al. 2016).
High-protein diet decreases weight, fasting
glucose, and insulin concentrations as well as
total and abdominal fat. In addition, this diet
significantly decreases LDL cholesterol
concentrations (Parker et al. 2002). Dietary pro-
tein intake in humans has been associated with the
Bacteroides enterotype (Oriach et al. 2016).
In previous studies, we obtained data
demonstrating that extracts of certain edible
plants rich in biologically active substances
(BAS) specifically stimulate the immune
response and have anti-inflammatory properties.
We also proved that these extracts are able to
specifically modulate intestinal microbiota (Bati
and Boyko 2013).
In our previous studies involving different
mouse models, we showed the molecular mecha-
nism by which different gut commensal
representatives modulate local immune response
at mucosal sites in a strain- or species-specific
manner. We were able to analyse in vitro the
effects of individual commensal bacteria on
human monocyte-derived dendritic cells
(moDCs)-mediated inflammation and effector
T-lymphocyte priming conditions mimicking
unique intestinal microenvironment. Human
moDCs expressing peroxisome proliferator-
activated receptor gamma (PPARγ) also regulate
cell surface expression of type I and II CD1
glycoprotein receptors as well as mucosa-
associated CD103 protein differently in the
absence or presence of all-trans-retinoic acid
(ATRA), when ATRA provides a tolerogenic
effect. In other words, this makes the pro- and
anti-inflammatory reprogramming of this popula-
tion of immune cells possible (Bene et al. 2017).
However, applying all these observations in
practice taking into consideration patients’
microbiome uniqueness is a challenge.
Additionally, it is known that the geographical
location of plant food ingredients’ growth affects
the quantitative and qualitative composition of
their BAS. Also, geographical location
determines people’s lifestyles, their habits and
traditions, and diets.
Previously, within the BaSeFood project, we
conducted a study of priority dishes in the Black
Sea region, including Ukrainian ones. We deter-
mined the nutritional value and composition of
food products, which formed the basis for the
creation of the First National Composite Database
of Food (Costa et al. 2013). One of the tasks of
this work was to investigate the fundamental pos-
sibility of creating or developing personalized
(individual) approaches (diet plans) using tradi-
tional dishes (based on traditional dishes) of our
region as a source of BAS selected for their
known biological effects on the microbiome and
local immune response and that could be used to
treat T2D in a controlled diet study (Danesi et al.
2013; Pallah et al. 2019).
Personalized Nutrition for Microbiota Correction and Metabolism Restore in...
Following to numerous in vitro studies (Pallah
et al. 2019; Bati and Boyko 2016, 2017) and
based on in vivo experiments data about main
influences of various plant originated compounds
and defined beneficial lactic acid bacteria (LAB)
strains on gut microbiota, mucosal immune
response and lipid metabolism of tested mice
and rats (Bati and Boyko 2016; Meleshko et al.
2020) the selection procedure of most promising
ethnical foods had been performed.
Thus, the aim of this study was to investigate
the possibility of correction of lipid metabolism
of patients with T2D using a personalised diet
based on the most important microbial, biochem-
ical, and immunological biomarkers of chronic
inflammation.
To achieve this goal, we focused on lipid
metabolism, immune, and microbiome
biomarkers as a whole, as well as patients’ indi-
vidual characteristics (differences), to be able to
regulate those indices that are considered major
evidence-based determinants of T2D.
2 Materials and Methods
Patients of the Mukachevo Central District Hos-
pital, Therapy Department, took part in the con-
trolled clinical trial; all participants gave written
informed consent.
Women aged 39–68 years with T2D were
selected according to the criteria typical of this
nosology (DeFronzo et al. 2015). Exclusionary
criteria involved smoking, alcohol or drug
abuse, pregnancy, and unstable medical status.
No participants had clinically significant cardio-
vascular, renal or liver disease, a history of cancer
or any other comorbidities. Patients who
participated in the study did not take any other
drugs.
Eligibility requirements were fulfilled and
enrolment procedures were performed in accor-
dance with the EU Clinical Trials Regulation
(Regulation (EU) No 536/2014). The study pro-
tocol was approved by the Uzhhorod National
University, Research Ethics Committee.
To confirm the effectiveness of personalized
diet plans, a randomized controlled trial was
conducted in two parallel groups. Group I (exper-
imental one) included patients who followed an
18-day personalized diet, which included individ-
ually selected products rich in BAS and yogurts
with unique microbial starters. Group II (control
one) involved patients who, for 18 days, ate
berries and yogurt prepared without microbial
starters in the morning. Patients were not
instructed to do additional physical exercise.
The experimental group consisted of 35 patients
and the control one of 21 patients. The study
lasted for roughly a month. Before and after the
diet course we measured five groups of
parameters (total 62 parameters): (1) patients’
biochemical status; (2) gut microbiota; (3) oral
microbiota; (4) immune status; and (5) physical
parameters of patients (measurement of body
weight, circumference of waist, thighs, and
upper thighs). Gut and oral microbiota studies
were performed in dynamics on days 1, 7,
11 and 18 of the experiment.
In order to conduct measurements, that is to
determine the condition (severity and course of
the disease), for each individual we identified
typical to this disease diagnostic markers for the
detection of T2D, such as blood glucose, lipid
profile (cholesterol, LDL, HDL, VLDL,
triglycerides, and atherogenicity levels),
glycosylated haemoglobin, total protein, and bili-
rubin levels, as well as typical diagnostic
enzymes (amylase, alkaline phosphatase, aspar-
tate aminotransferase, alanine aminotransferase,
lactate dehydrogenase, gamma-glutamyl transfer-
ase, and total creatine kinase), thymol test, and
indicators measuring the state of the excretory
system (albumin, urea and uric acid, and total
creatinine) and micro- (iron) and macronutrient
(potassium, magnesium, calcium, sodium) blood
composition, as an evidence of existing metabolic
disorders. Regarding immune parameters, we
limited ourselves to the well-known indicators
of inflammatory processes, that is markers of
inflammation and their agonists (IL-1β, Il-10,
TNF-α). However, we also considered previously
identified (selected) local inflammation markers,
such as levels of total and secretory immunoglob-
ulin A in serum (IgA, SIgA. During the study of
intestinal and oral microbiome we focused on
T. Meleshko et al.
such target groups of microorganisms as (1) typi-
cal intestinal commensals and the so-called bene-
ficial microorganisms (Enterobacteriaceae family,
genera Staphylococcus, Streptococcus, Lactoba-
cillus, Candida, Clostridium spp.); (2) opportunis-
tic microorganisms - Pseudomonas aeruginosa,
E. faecalis, Staphylococcus spp., Enterobac-
teriaceae; (3) markers of metabolic disorders that
we identified earlier (E. coli lac+, E. coli lac-,
Bifidobacterium spp., Enterococcus spp.) (Petrov
and Boyko 2014).
Blood formula (red and white blood cells,
monocytes, lymphocytes, platelet assay, and
eosinophils) was identified using Mythic
22 Orphee S.A. (Switzerland) Haematology sys-
tem. Erythrocyte sedimentation rate (ESR) was
measured using the Westergren method.
Haemoglobin was identified calorimetrically. All
biochemical parameters were assayed using
Cobas c 311 (Roche/Hitachi) Switzerland.
Intestinal and oral microbes were studied
according to our own method using the following
nutrient media: Mitis Salivarius Agar, Bile
Esculin Agar, Mannitol Salt Agar, Endo Agar,
Bismuth Sulphite Agar, HiCrome Clostridial
Agar, Sabouraud Dextrose Agar, Lactobacillus
MRS Agar, Bifidobacterium Agar, Bacteroides
bile esculin agar, Propionibacter Isolation Agar,
L.D. Esculin HiVegTM Agar (manufactured by
HiMedia Laboratories, India), UriSelectTM
4 Medium (Bio-Rad Laboratories, Inc., USA),
and Blaurock semi-liquid modified hepatic
medium (manufactured by Liofilchem, Italy).
Identification of isolated microorganisms was
performed using biochemical test systems
ANAERO-23, ENTERO-24, NEFERM-test,
Candida-23, STAPHY-16, and STREPTO test
24 (Erba Lachema s.r.o., Czech Republic).
Microbiome studies were also performed using
real-time polymerase chain reaction (qPCR).
Immune parameters were measured using indica-
tor immunosorbent systems Vector-Best (Russian
Federation); results were read at a wavelength of
450 nm using a plate immunosorbent assay
BioTek Elx800.
With the help of the developed information
system and created an algorithm based on linear
programming approaches, which allows selecting
food for any individual (patient) in accordance
with the state of her gut microbiota and immune
and biochemical parameters, a personalized diet
was developed for each participant of the experi-
ment. Developed diets included products that
contain functioning groups of biologically active
substances such as polyphenols, anthocyanins,
and flavonoids as well as unique microbial
starters for fermentation. Sequenced strains of
Lactobacillus casei IMB B-7412, Lactobacillus
plantarum IMB B-7414, and Lactobacillus
plantarum IMB B-7413 were used to prepare
yogurts. The selection of food products was
based on WHO recommendations (https://www.who.int/nutrition/publications/nutrient/en/),
tak-ing into account individual wishes and contrain-
dications, as well as when determining the portion
size - individual characteristics of patients such as
the level of physical activity, body mass
index, etc.
Statistical analyses were performed using the
statistical program GraphPad Prism version 3.00
(GraphPad Software, USA). All data are
presented as the mean SD or mean SE. For
normally distributed data, checked used Shapiro-
Wilk test, comparisons were tested using
ANOVA. The two-tailed Mann-Whitney U-test
was used for comparisons between the groups. P
values <0.05 were considered statistically
significant.
3 Results
On the first day of the experiment, in all patients
diagnosed with type 2 diabetes there was an
increase in the level of biochemical parameters
observed: glucose (the real average value is
8 times higher than the allowed excess of the
average value of the norm), LDH (the real aver-
age value is 5 times higher than the allowed
excess of the average value of the norm),
HbA1C (the real average value is 1,5 times higher
than the allowed excess of the average value of
the norm), and immunological indicator IL-10
(the real average value is 2 times higher than the
allowed excess of the average value of the norm),
as well as physical parameters such as BMI (the real average value is 5,5 times higher than the
allowed excess of the average value of the norm).
Also, a decrease in HDL levels was observed: the
real average value is 1.5 times lower than the
allowed decrease in the average value of the
norm (see Table 1, Fig. 1).
The composition of the intestinal microbiota
on day 1 of the experiment demonstrated a pre-
dominance of enterococci and lactobacilli with a
significant variety of commensal and opportunis-
tic microorganisms, namely enterobacteria,
pseudomonads, streptococci, staphylococci,
bacilli, and candida. We observed an increase
level of E. faecalis (the real average value is
2 times higher than the allowed excess of the
average value of the norm), a decrease in levels
of E. coli (lac+) (the real average value is more
than 8 times lower than the allowed decrease in
the average value of the norm), E. coli (lac) (the
real average value is 4 times lower than the
allowed decrease in the average value of the
norm) and Lactobacillus spp. (the real average
value is more than 1,5 times lower than the
allowed decrease in the average value of the
norm) (see Figs. 2 and 3). The oral microbiota
was characterized by a predominance of
lactobacilli, enterococci, and streptococci, as
well as a number of other bacteria, such as
E. coli (lac+), Citrobacter spp., E. cloacae,
P. aeruginosa, S. epidermidis, Bacillus spp., and
Candida spp. We observed an increased level of
E. faecalis (the real average value is 4 times
higher than the allowed excess of the average
value of the norm), Lactobacillus spp. (the real
average value is 7,5 times higher than the allowed
excess of the average value of the norm),
P. aeruginosa and Candida spp. (the real average
value is 2 times higher than the allowed excess of
the average value of the norm) (see Figs. 2 and 4).
On the first day of the experiment, no statistically
significant difference was observed between the
control and experimental groups.
After 18 days of the experiment, no statisti-
cally significant changes in parameters were
observed in the control group, but there were
changes in blood and physical parameters and
microbiota composition in the experimental
group. According to the data obtained, there was
a decrease in the levels of such biochemical
parameters as glucose, bilirubin, thymol test, cho-
lesterol, HDL, LDL, VLDL, iron, gamma-
glutamyl transferase, total protein, urea, creati-
nine, LDH, HbA1C, and triglycerides as well as
changes in all immune and physical parameters.
Also, an increase in amylase, alkaline phospha-
tase, calcium, creatine kinase, aspartate transfer-
ase, alanine aminotransferase, uric acid, sodium,
magnesium, albumin, and atherogenicity levels
was observed. Herewith, on day 18 of the experi-
ment all indicators were almost unchanged in the
control group (see Table 1).
After adherence to a personalized diet, in the
experimental group patients there was a statisti-
cally significant reduction in the following
parameters: glucose, thymol test, VLDL, urea,
creatinine, sIgA, and TNF-a, as well as all physical
parameters. There was a statistically significant
increase in such biochemical parameters as uric
acid, sodium, and magnesium. Regarding intesti-
nal microbiota indicators, there was a decrease in
the levels of all microbiota members except
lactobacilli. Statistically significant changes were
observed in Enterococcus faecalis, Escherichia
coli (lac+), Escherichia coli (lac), Lactobacillus
spp., and Candida spp. The oral microbiota was
characterized by a decrease in the number of all
representatives except lactobacilli. Such
microorganisms as E. faecalis, Lactobacillus
spp., P. aeruginosa, and Candida spp.
demonstrated statistically significant changes.
Statistically significant changes in the concen-
tration of microorganisms (in dynamics) were
observed in both the intestinal microbiota
(E. faecalis, E. coli (lac+), E. coli (lac), Lacto-
bacillus spp., and Candida spp.) and oral
microbiota (E. faecalis, Lactobacillus spp.,
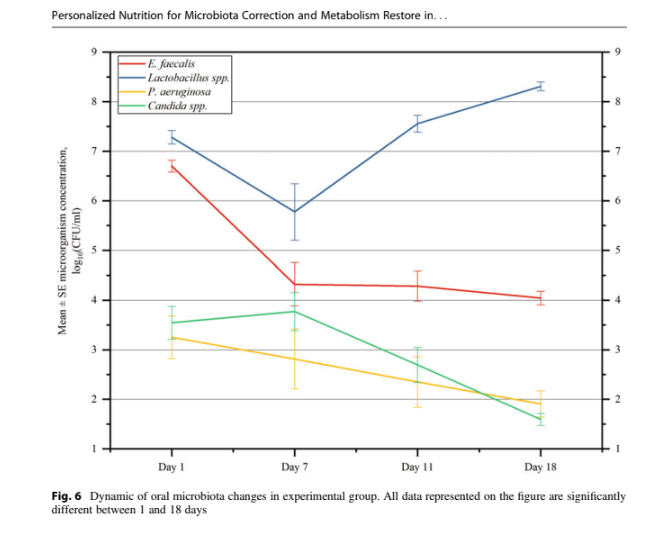
P. aeruginosa, and Candida spp.) (see Figs. 5
and 6). Dynamic intestinal microbiota changes
in the experimental group (see Fig. 4) demon-
strate that the average concentration of
E. faecalis remained unchanged until day
11 while a statistically significant ifference com-
pared to the first day appeared on day 11 and the
tendency to a decrease remained on day 18 of the
experiment. E. coli (lac+) is characterized by a
decrease in concentration throughout the


observation period, but a statistically significant
difference appeared on day 11 compared to day
1. A statistically significant difference in the
concentration of E. coli (lac) was also observed
on day 7 of the experiment and then an increase
was observed on day 11, with a further decrease


on day 18. The concentration of Lactobacillus
spp. did not change statistically significantly
until day 11; there was a sharp increase in con-
centration on day 18. For Candida spp., on the
contrary, there was a statistically significant
decrease on day 7 with the absence of statistically
significant changes in subsequent days (see
Fig. 5).
The oral microbiota is characterized by a sharp
decrease in the concentration of E. faecalis on day
in concentration. Lactobacillus spp. demonstrated
a statistically significant decrease in concentration
on day 7 with further growth dynamics. The
concentration of P. aeruginosa decreased during
the experiment and a statistically significant
difference was observed on day 11 compared to
day 1. Candida spp. is characterized by a slight
increase in concentration on day 7 and a further
decrease until day 18 of the experiment while a
statistically significant change was observed on
days 7–11 and 7–18 (see Fig. 6).
4 Discussion
The issue of treatment of type 2 diabetes is still
relevant. Emergence of a number of new markers
greatly simplifies and increases the accuracy of
the disease diagnosis, but medical personnel still
mostly uses long-tested, “classic” markers of dia-
betes, in particular because of their availability for

analysis (DeFronzo et al. 2015). In our work, we
used a classic set of such markers as well as a
number of other indicators, including intestinal
and oral microbiota as recent publications empha-
size its significant role in the development of type
2 diabetes and human health in general (Gurung
et al. 2020; Sharma and Tripathi 2019).
According to the results of indicators’ change
during the experiment, there are improvements
in a number of markers, such as VLDL, glucose,
creatinine, urea, magnesium, sodium, thymol test,
and uric acid.
VLDL involves pre-beta-lipoproteins that are
formed in the liver and are the main transport
form of endogenous triglycerides. They are clas-
sified as highly atherogenic lipoproteins involved
in the formation of atherosclerotic plaques.
Hance, a decrease in VLDL indicates an improve-
ment in lipid metabolism, reducing the risk of
atherosclerosis and coronary heart disease devel-
oping (Xie et al. 2017). Elevated glucose levels
are one of the main diagnostic markers of T2D,
and, therefore, a decrease in its level indicates that
our proposed diet has a therapeutic effect.
In addition, we noticed a statistically signifi-
cant decrease in creatinine and urea levels was
observed in all patients in the experimental group.
This change resulted from an increase in the con-
sumption of vegetables and fruits, as well as a
decrease in the consumption of meat products.
According to the analysis of literature data, a
decrease in the levels of these biochemical

parameters within normal limits may be indica-
tive of normalization of the renal excretory func-
tion (Gowda et al. 2010).
According to previous research, diabetes
mellitus is one of the diseases with increased
frequency of electrolyte abnormalities given that
the impaired renal function, malabsorption
syndromes, and acid-base disorders are often
present in diabetic patients (Liamis et al. 2014).
Magnesium deficiency may relate to the develop-
ment of atherosclerosis, coronary heart disease,
and cardiac arrhythmias while low blood magne-
sium is associated with the development of insu-
lin resistance (Kostov 2019). According to
experimental data obtained, we observed an
increase in the concentration of magnesium in
experimental group patients compared to the con-
trol group which demonstrated a tendency to an
increase in the concentration of this indicator.
It should be noted that hyponatremia is
associated with increased plasma glucose
concentrations (Liamis et al. 2015). As a result
of adherence to the personalized diet, patients in
the experimental group demonstrated an increase
in the concentration of another microelement,
sodium, compared to the control group, in which
this indicator remained almost unchanged
throughout the study. Sufficient sodium concen-
tration is extremely important for proper function-
ing of membrane transport, muscle contraction,
nerve impulse transmission, and many other vital
functions (Constantin and Alexandru 2011), and
therefore, normalization of this indicator indicates
the effectiveness of the proposed diet.
A statistically significant decrease in thymol
test levels within normal limits can indicate
improvement of liver function (Djiambou-
Nganjeu 2019). A statistically significant increase
in uric acid levels within normal limits can be
explained by the increase in the consumption of
foods containing fructose, such as apples,
persimmons, blueberries, pears and dried fruits.
Another important result is a change in the
microbiota of the experimental group patients.
The study demonstrated a statistically significant
decrease in enterococci, E. coli, and Candida spp.
concentration, as well as an increase in
lactobacilli concentration. This indicates the nor-
malization of intestinal microbiota, which, in
turn, leads to metabolism improvement, including
glucose and cholesterol metabolism (Ma et al.
2019).
All the above-mentioned changes in biochem-
ical and immunological parameters, as well as
normalization of patients’ gut and oral
microbiota, cause changes in patients’ physical
parameters, namely a statistically significant
decrease in body weight and the circumference
of waist, hips, and upper thighs in all patients of
the experimental group.
Data on the immune status of the experimental
group patients demonstrated that there is a statis-
tically significant decrease in the levels of secre-
tory IgA and proinflammatory cytokine TNF-α
compared to the control group demonstrating a
tendency to a decrease in these indicators (see
Table 1). Literature analysis shows that TNF-α
is considered one of the many risk factors in the
development of type 2 diabetes. With regard to
type 2 diabetes, it affects glucose metabolism,
sensitivity of peripheral tissues to insulin, and
renin-angiotensin system, and is involved in the
development of oxidative stress. It possesses
cytotoxic activity, promotes endothelial dysfunc-
tion, and is able to induce apoptosis of insulin
producing cells (Dombrovska 2017). Thus, we
Fig. 6 Dynamic of oral microbiota changes in experimental group. All data represented on the figure are significantly
different between 1 and 18 days
Personalized Nutrition for Microbiota Correction and Metabolism Restore in...
can conclude that a decrease in TNF-α level
confirms the effectiveness of the proposed diet.
All this confirms the hypothesis of the possi-
bility of personalized diet use for treatment of
type 2 diabetes. In general, diets are often used
in type 2 diabetes treatment. The Mediterranean
diet is known to be one of the most studied diets
and its positive effect on health has been proved
(Trichopoulou et al. 2005). In addition, this diet is
claimed to be effective in prevention and treat-
ment of type 2 diabetes (Pérez-Jiménez et al.
2002). Research (Shai et al. 2008; Esposito et al.
2009) showed that the use of the Mediterranean
diet leads to a statistically significant decrease in
glucose and glycosylated haemoglobin in blood,
as well as a decrease in weight and body mass
index. Herewith, in our work we did not observe
statistically significant changes in glycosylated
haemoglobin in patients of the experimental
group. This may be due to the short duration of
the proposed diet (18 days), as this biochemical
blood indicator reflects the average content of
glucose in blood over a long period of time
(3–4 months).
It should be noted that literature does not pro-
vide data on the changes in such biochemical
indicators as urea, thymol test, uric acid, creati-
nine, sodium, and magnesium under the influence
of diet in patients with diabetes mellitus. The
reason may be that only classic markers of diabe-
tes, such as glucose, glycosylated haemoglobin,
cholesterol, triglycerides, low-density lipopro-
tein, very low-density lipoprotein, and high-
density lipoprotein, are usually studied. However,
most diets used in type 2 diabetes treatment do
not consider the patient’s condition and are not
personalized. The most valuable in this regard is
the known approach to adjusting body state in
type 2 diabetes based on the glycaemic index
(Zeevi et al. 2015). The study demonstrated the
ability to predict the glycaemic response to the
use of certain foods, which resulted in the possi-
bility of making plans for personalized nutrition
and adjusting intestinal microbiota. They used
blood parameters, dietary habits, anthro-
pometrics, physical activity, and gut microbiota
measured to predict personalized postprandial
glycaemic responses to daily consumed meals.
The results of cohort study suggest that
personalized diets may consistently alter gut
microbiota configuration and successfully modify
elevated postprandial blood glucose and its meta-
bolic consequences. However, this approach is
difficult to implement and it is not based on the
use of BAS, which are extremely promising in
terms of correction of not only body condition in
type 2 diabetes, but also a number of other
diseases.
5 Conclusions
A personalized diet based on the use of individu-
ally selected BAS and probiotic microorganisms
is one of the possible ways to improve the condi-
tion of patients with type 2 diabetes. Its use in the
experimental group of 35 patients led to the
improvement in a number of biochemical (glu-
cose, thymol test, VLDL, urea, uric acid, creati-
nine, sodium, and magnesium), immunological
(sIgA, TNF-a), and all physical parameters. The
intestinal and oral microbiota condition also
normalized. Reduction in E. faecalis, E. coli,
P. aeruginosa, and Candida spp., as well as an
increase in the number of lactobacilli, was
observed. Statistically significant changes were
observed in only a small number of the studied
62 markers, so it is important to identify a narrow
range of priority biomarkers. The results obtained
can be used for further treatment of patients with
type 2 diabetes and introduction of personalized
medicine in Ukraine.
Conflict of Interest The authors declare no conflicts of
interest in relation to this article.
Funding This work was supported by Ministry of Edu-
cation and Science, Topic: “The introduction of new
approaches to the creation and use of modern
pharmabiotics” Registration number 0117 U000379.
References
Anderson JW, Baird P, Davis RH Jr, Ferreri S,
Knudtson M, Koraym A, Waters V, Williams CL
(2009) Health benefits of dietary fiber. Nutr Rev 67
T. Meleshko et al.
(4):188–205. https://doi.org/10.1111/j.1753-4887.
2009.00189.x
Bati VV, Boyko NV (2013) Pro- i antymikrobni
vlastyvosti ekstraktiv vydilenikh z roslyn i produktiv
kharchuvannya roslynnoho pokhodzhennya.
Biolochno aktyvni rechovyny i materialy:
fundamental0
ni ta prykladni pytannya otrymannya
[Pro- and antimicrobial properties of extracts isolated
from plants and foods of plant origin. Biologically
active substances and materials: fundamental and
applied issues of production]. In, Krym, 26 May –
1 June 2013. Novyy svit, pp 267–268
Bati VV, Boyko N (2016) The biological properties of
Lactоbacilli strains Isolаted from food of plant origin
and edible plants. ScienceRise 8(25):6–14. https://doi.
org/10.15587/2313-8416.2016.76712
Bati VV, Boyko N (2017) Microbiological analysis of
sauerkraut in the process of its fermentation according
to the traditional and modernized technologies.
Microbiol Biotechnol (2):90–100. https://doi.org/10.
18524/2307-4663.2017.2(38).105108
Bene K, Varga Z, Petrov VO, Boyko N, Rajnavolgyi E
(2017) Gut microbiota species can provoke both
inflammatory and Tolerogenic immune responses in
human dendritic cells mediated by retinoic acid recep-
tor alpha ligation. Front Immunol 8:427. https://doi.
org/10.3389/fimmu.2017.00427
Cani PD, Osto M, Geurts L, Everard A (2012) Involve-
ment of gut microbiota in the development of
low-grade inflammation and type 2 diabetes associated
with obesity. Gut Microbes 3(4):279–288. https://doi.
org/10.4161/gmic.19625
Constantin M, Alexandru I (2011) The role of sodium in
the body. Balneo-Res J 2(1):70–74
Costa HS, Albuquerque TG, Sanches-Silva A,
Vasilopoulou E, Trichopoulou A, D’Antuono LF,
Alexieva I, Boyko N, Costea C, Fedosova K,
Hayran O, Karpenko D, Kilasonia Z, Finglas P
(2013) New nutritional composition data on selected
traditional foods consumed in Black Sea Area
countries. J Sci Food Agric 93(14):3524–3534.
Danesi F, Pasini F, Caboni MF, D’Antuono LF,
Bordoni A, BaSeFood C (2013) Traditional foods for
health: screening of the antioxidant capacity and phe-
nolic content of selected Black Sea area local foods. J
Sci Food Agric 93(14):3595–3603. https://doi.org/10.
1002/jsfa.6339
DeFronzo RA, Ferrannini E, Groop L, Henry RR, Herman
WH, Holst JJ, Hu FB, Kahn CR, Raz I, Shulman GI,
Simonson DC, Testa MA, Weiss R (2015) Type 2 dia-
betes mellitus. Nat Rev Dis Primers 1:15019. https://
Dinu M, Abbate R, Gensini GF, Casini A, Sofi F (2017)
Vegetarian, vegan diets and multiple health outcomes:
a systematic review with meta-analysis of observa-
tional studies. Crit Rev Food Sci Nutr 57
(17):3640–3649. https://doi.org/10.1080/10408398.
2016.1138447
Djiambou-Nganjeu H (2019) Relationship between portal
HTN and cirrhosis as a cause for diabetes. J Transl
Intern Med 7(2):79–83
Dombrovska NS (2017) Tumour necrosis factor alpha as
proinflammatory cytokine and its importance in devel-
opment of type 2 diabetes. Curr Probl Mod Med Bull
Ukr Med Dent Acad (in Ukrainian) 17(2):58
Ercolini D, Fogliano V (2018) Food design to feed the
human gut microbiota. J Agric Food Chem 66
(15):3754–3758. https://doi.org/10.1021/acs.jafc.
8b00456
Esposito K, Maiorino M, Di Palo C, Giugliano D, Group
CPHS (2009) Adherence to a Mediterranean diet and
glycaemic control in type 2 diabetes mellitus. Diabet
Med 26(9):900–907
Gowda S, Desai PB, Kulkarni SS, Hull VV, Math AA,
Vernekar SN (2010) Markers of renal function tests. N
Am J Med Sci 2(4):170
Group NHW, Peterson J, Garges S, Giovanni M,
McInnes P, Wang L, Schloss JA, Bonazzi V, McEwen
JE, Wetterstrand KA, Deal C, Baker CC, Di
Francesco V, Howcroft TK, Karp RW, Lunsford RD,
Wellington CR, Belachew T, Wright M, Giblin C,
David H, Mills M, Salomon R, Mullins C,
Akolkar B, Begg L, Davis C, Grandison L,
Humble M, Khalsa J, Little AR, Peavy H, Pontzer C,
Portnoy M, Sayre MH, Starke-Reed P, Zakhari S,
Read J, Watson B, Guyer M (2009) The NIH human
microbiome project. Genome Res 19(12):2317–2323.
Gurung M, Li Z, You H, Rodrigues R, Jump DB,
Morgun A, Shulzhenko N (2020) Role of gut
microbiota in type 2 diabetes pathophysiology.
EBioMedicine 51:102590
Kastorini CM, Milionis HJ, Esposito K, Giugliano D,
Goudevenos JA, Panagiotakos DB (2011) The effect
of Mediterranean diet on metabolic syndrome and its
components: a meta-analysis of 50 studies and 534,906
individuals. J Am Coll Cardiol 57(11):1299–1313.
Kostov K (2019) Effects of magnesium deficiency on
mechanisms of insulin resistance in type 2 diabetes:
focusing on the processes of insulin secretion and
signaling. Int J Mol Sci 20(6):1351
Krauss RM (2004) Lipids and lipoproteins in patients with
type 2 diabetes. Diabetes Care 27(6):1496–1504
Liamis G, Liberopoulos E, Barkas F, Elisaf M (2014)
Diabetes mellitus and electrolyte disorders. World J
Clin Cases 2(10):488
Liamis G, Tsimihodimos V, Elisaf M (2015)
Hyponatremia in diabetes mellitus: clues to diagnosis
and treatment. J Diabetes Metab 6(5):559–561
Ma Q, Li Y, Li P, Wang M, Wang J, Tang Z, Wang T,
Luo L, Wang C, Zhao B (2019) Research progress in
the relationship between type 2 diabetes mellitus and
intestinal flora. Biomed Pharmacother 117:109138
Meleshko TV, Pallah OV, Petrov VO, Boyko NV (2020)
Extracts of pomegranate, persimmon, nettle, dill, kale
and Sideritis specifically modulate gut microbiota and
Personalized Nutrition for Microbiota Correction and Metabolism Restore in...
local cytokines production: in vivo study. ScienceRise
Biol Science 2(23):4–14. https://doi.org/10.15587/
2519-8025.2020.204781
Minihane AM, Vinoy S, Russell WR, Baka A, Roche HM,
Tuohy KM, Teeling JL, Blaak EE, Fenech M,
Vauzour D, McArdle HJ, Kremer BH, Sterkman L,
Vafeiadou K, Benedetti MM, Williams CM, Calder
PC (2015) Low-grade inflammation, diet composition
and health: current research evidence and its transla-
tion. Br J Nutr 114(7):999–1012. https://doi.org/10.
1017/S0007114515002093
Oriach CS, Robertson RC, Stanton C, Cryan JF, Dinan TG
(2016) Food for thought: the role of nutrition in the
microbiota-gut–brain axis. Clin Nutr Exp 6:25–38.
Pallah O, Meleshko T, Bati V, Boyko N (2019) Extracts of
edible plants stimulators for beneficial
microorganisms. Biotechnol Acta 12(3):67–74.
Parker B, Noakes M, Luscombe N, Clifton P (2002) Effect
of a high-protein, high-monounsaturated fat weight
loss diet on glycemic control and lipid levels in type
2 diabetes. Diabetes Care 25(3):425–430. https://doi.
org/10.2337/diacare.25.3.425
Pérez-Jiménez F, López-Miranda J, Mata P (2002) Protec-
tive effect of dietary monounsaturated fat on arterio-
sclerosis: beyond cholesterol. Atherosclerosis 163
(2):385–398. https://doi.org/10.1016/S0021-9150(02)
00033-3
Petrov VO, Boyko NV (2014) Early markers for
diagnostics of obesity, diabetes, and metabolic syn-
drome. Ukraine Patent
Raj R, Navis S, Bhatti JS, Bhadada SK, Ramteke PW
(2018) Analysis of complicating risk factors of type
2 diabetes mellitus (T2DM). Integr Obes Diab. https://
Raychaudhuri S (2011) Mapping rare and common causal
alleles for complex human diseases. Cell 147
(1):57–69. https://doi.org/10.1016/j.cell.2011.09.011
Shai I, Schwarzfuchs D, Henkin Y, Shahar DR, Witkow S,
Greenberg I, Golan R, Fraser D, Bolotin A, Vardi H,
Tangi-Rozental O, Zuk-Ramot R, Sarusi B,
Brickner D, Schwartz Z, Sheiner E, Marko R,
Katorza E, Thiery J, Fiedler GM, Bluher M,
Stumvoll M, Stampfer MJ, Dietary Intervention
Randomized Controlled Trial G (2008) Weight loss
with a low-carbohydrate, Mediterranean, or low-fat
diet. N Engl J Med 359(3):229–241. https://doi.org/
10.1056/NEJMoa0708681
Shanahan F, van Sinderen D, O’Toole PW, Stanton C
(2017) Feeding the microbiota: transducer of nutrient
signals for the host. Gut 66(9):1709–1717. https://doi.
org/10.1136/gutjnl-2017-313872
Sharma S, Tripathi P (2019) Gut microbiome and type
2 diabetes: where we are and where to go? J Nutr
Biochem 63:101–108
Singh RK, Chang HW, Yan D, Lee KM, Ucmak D,
Wong K, Abrouk M, Farahnik B, Nakamura M, Zhu
TH, Bhutani T, Liao W (2017) Influence of diet on the
gut microbiome and implications for human health. J
Transl Med 15(1):73. https://doi.org/10.1186/s12967-
017-1175-y
Tilg H, Moschen AR (2014) Microbiota and diabetes: an
evolving relationship. Gut 63(9):1513–1521. https://
Trichopoulou A, Naska A, Orfanos P, Trichopoulos D
(2005) Mediterranean diet in relation to body mass
index and waist-to-hip ratio: the Greek European Pro-
spective Investigation into Cancer and Nutrition Study.
Am J Clin Nutr 82(5):935–940. https://doi.org/10.
1093/ajcn/82.5.935
Wu GD, Compher C, Chen EZ, Smith SA, Shah RD,
Bittinger K, Chehoud C, Albenberg LG, Nessel L,
Gilroy E, Star J, Weljie AM, Flint HJ, Metz DC,
Bennett MJ, Li H, Bushman FD, Lewis JD (2016)
Comparative metabolomics in vegans and omnivores
reveal constraints on diet-dependent gut microbiota
metabolite production. Gut 65(1):63–72. https://doi.
org/10.1136/gutjnl-2014-308209
Xie X, Zhang X, Xiang S, Yan X, Huang H, Tian Y,
Shou Z, Chen J (2017) Association of very
low-density lipoprotein cholesterol with all-cause and
cardiovascular mortality in peritoneal dialysis. Kidney
Blood Press Res 42(1):52–61
Zeevi D, Korem T, Zmora N, Israeli D, Rothschild D,
Weinberger A, Ben-Yacov O, Lador D, Avnit-Sagi T,
Lotan-Pompan M, Suez J, Mahdi JA, Matot E,
Malka G, Kosower N, Rein M, Zilberman-Schapira G,
Dohnalova L, Pevsner-Fischer M, Bikovsky R,
Halpern Z, Elinav E, Segal E (2015) Personalized
nutrition by prediction of glycemic responses. Cell
163(5):1079–1094. https://doi.org/10.1016/j.cell.
2015.11.001


Коментарі