Common nutrition and health issues in Eastern Europe
- ediensofficial
- 27 жовт.
- Читати 54 хв

Roman Rukavchuk, Liudmyla Kozlovska, Tayisiya Simochko, Nadiya Boyko
Eastern European (EE) traditional foods (TF): an introduction
The countries of the Eastern Europe Region (EER), including Belarus, Russia, North
Caucasus Region, Tatarstan, Ukraine, Lithuania, Latvia, and Estonia, have common
nutrition and health issues shaped by the long “common living” history under the Soviet
Union umbrella and unique shaped by their national way of developments.
To clarify which aspects mainly influence human healthdeconomic, cultural,
othersdthe most important factor is to discover an appropriate, standardized, and timely
commonly accepted methodology or way for detection and proving the evidence for a
strong connection, interaction, and correlation, in our case, between nutrition and
health. In other words, an accurate and realistic conclusion could be made based only
on clearly defined and exact statistical facts about the most commonly consumed foods,
data about their nutritional value, and the interrelationship with the health condition of
the population relevant to the consumption and nutrition indices.
The category of “often eaten food” is usually and typically represented by tradition-
ally (routinely) consumed national foods. These traditional (ethnical) dishes’ are mainly
dependent on a variety of a country’s unique factors that result in the formation of
so-called “national food perception” (D’Antuono and Bignami, 2012). Numerous papers
recently provide detailed descriptions of traditional foods (TFs). The various terms
proposed use different approaches. Some were mainly concluded after surveys made
by consumers and thus were oriented on their feelings and the behavioral acceptance
Nutritional and Health Aspects of Food in Eastern Europe
ISBN 978-0-12-811734-7, https://doi.org/10.1016/B978-0-12-811734-7.00008-6
© 2022 Elsevier Inc.
All rights reserved. 187
of country- or national-specific foods categories. Others were based on points of histor-
ical developments of nutrition or diet traditions as a most crucial issue. Some novel ways
have been recently applied to find a more comprehensive definition of “ethnic food”
products through a synergistic combination of all the complex facets and sides of this
quite complicated subject (D’Antuono, 2013).
Finally, the simple definition of TF could be summarized as a nation’s commonly
accepted and culture uniqueness as represented by dishes and drinks, the recipes of which
have historical roots and were documented before the Second World War. The results of
a cross-cultural study devoted to all the trends in the developments of traditional foods
and all the factors influenced by modern technology, innovations, and challenges
affecting local food products have been well reported (Guerrero et al., 2009).
Thus, the cornerstones for TF are: (1) place, territory; (2) individual operation, cul-
ture, (3) perception of acceptance, (4) recognition; (5) transmission between generations
for at least for 25 years (understanding of “traditional” related to food as proposed by EC),
but only a few definitions are relevant to “nutrition.” EuroFIR has proposed a coherent
term for TF, which is very useful in the context of health influence issues as it includes
calculating the most important information about all food ingredients, their combination
and composition, and also processing and preservation methods (Dilis et al., 2013; Costa
et al., 2010; Slimani et al., 2007).
The list of exclusive descriptions of TF does not provide enough data to prove the
strong connection between food consumed and health conditions. To find a really strong
connection between often eaten preferential ethnic foods (products) and the health con-
dition of a population more investigations are needed. The required data should include
at least information about the biological active compounds of TFs, their varieties, local
differences in their content, microbial starters, and also information about typical pollut-
ants or xenobiotics, if any.
The first attempt to estimate the real direct influence of BSAC traditional foods and
their ingredients on human health was made by testing the content of different biolog-
ically active compounds in different traditional products of plant origin prioritized within
BaSeFood projects. These TFs belonged to six categories: (1) cereal or cereal-based foods;
(2) vegetables or vegetable-based foods; (3) fruit or fruit-based foods; (4) oilseeds or
oilseed products; (5) herbs, spices, and aromatic plants; and (6) low or nonalcoholic fer-
mented foods and beverages of plant origin. The obtained results of this multisectoral and
multidisciplinary research will be shortly concluded further, but clearly, such analytical
data collected for six BSAC countries are very valuable in making conclusions about
the possible health impacts. We also should note that EER during the last few years
have been subject to dramatic changes in their political and economic life. Thus in order
to understand the nutritionehealth connection axes we need overview first the speci-
ficity of the TFs of the nine above-mentioned countries and their behaviors or dietary
preferences, including the major characteristics of their cuisine. At the same time,
188 Nutritional and Health Aspects of Food in Eastern Europe
attention should be paid to the general changes in the mortality rates of the population of
the targeted EER countries.
An understanding of the main common background of the population’s food prefer-
ences and choices of these nine EER countries requires taking into account their histor-
ical context. The similarities of their natural “Slavic” or Soviet roots of post-USSR
countries during their common Soviet period has affected tremendously the formation
and development of nutritional behavior of this region’s people. Recognition of each
nation’ ethnic food priorities and their dramatic mixture in that time created a list of
so-called “Soviet national dishes,” which were mainly consumed on daily bases and
formed and maintained the health conditions of the population of all 15 Soviet Union
republics, including the countries and territories examined here.
From a Wikipedia source (Wikipedia contributors, 2020a), it is seen that the Soviet
Union foods list actually contains a mixture of different nationalities’ dishes and to esti-
mate the influence of eating behavior on population health before 1991 for all the Baltic
countries, Ukraine, and Belorussia (the Soviet Union recognized these countries as inde-
pendent on August 24, September 6, and December 25, 1991, respectively) this specific
“diet” and food preferences must be noted.
The food choices of the population of Russia, North Caucasus, and Tatarstan as well
as the rest of the reviewed countries are also related to their political and geographical
specificities. Three territories of Russia, Artsakh, Abkhazia and South Ossetia, claimed
independence but are recognized by only a handful of entities. Abkhazia and South Osse-
tia are recognized by the global community as part of Georgia, and Artsakh as part of
Azerbaijan. Geographically, the North Caucasus region is known as the Ciscaucasus,
whereas the South Caucasus region is commonly known as the Transcaucasus. These
all feature different landscape characteristics. The Ciscaucasus contains most of the
Greater Caucasus mountain range. It consists of Southern Russia, mainly the North
Caucasian Federal Districts’s autonomous republics, and the northernmost parts of
Georgia and Azerbaijan. The Ciscaucasus lies between the Black Sea to its west, the
Caspian Sea to its east, and borders the Southern Federal District to its north. The two
Federal Districts are collectively referred to as “Southern Russia” (Wikipedia contributors,
2020c), and they have all experienced different traditional ethnic dishes and therefore,
nutritional and health issues.
Nevertheless, that data for Belorussia and Russia related to nutrition and health
statistics have not changed dramatically since independence, as the other factors (social,
economics) affect the mortality and levels of diseases to a much greater degree. It had
been shown that before the collapse of the Soviet Union, Belarus, Lithuania, and Russia
were quite comparable in terms of their socioeconomic development. Despite some dif-
ferences detected in the overall mortality levels, the three former Soviet republics were
also very close to each other in terms of mortality trends and age-specific mortality pat-
terns. After 1991, these three countries experienced substantial political and social
Common nutrition and health issues in Eastern Europe 189
transformations and many challenges associated with the transition from a socialist to a
market economy system. These sudden changes brought about numerous problems
also for other post-Soviet Union republics, such as rapid growth in unemployment, fall-
ing standards of living, and growing social and income inequalities. These factors contrib-
uted to the significant deterioration of the health situation in all the countries reviewed,
but the size and nature of the mortality crisis were different and country-specific. The
marked similarities in socioeconomic and mortality trends in the countries up to 1991
turned in contrast with their notable divergence during the subsequent years. The nature
and success of market reforms seem to be the most plausible explanation for these differ-
ences. Russia, Lithuania, and Ukraine have chosen more radical forms of economic and
political transformations, which have led to massive privatization campaigns. The reforms
were more sustainable and systematic in Lithuania compared to the other countries. By
contrast, Belarus has chosen a gradual and slow transition path and recent mortality trends
in Belarus correspondingly are contrasted with those observed in Lithuania, Ukraine, and
Russia. Including a cause-of-death, the analysis sheds more light on the plausible deter-
minants of the variations in mortality levels between the countries mentioned here and
the other EER countries (Grigoriev et al., 2010).
The interrelationship and strong correlation between nutrition and health conditions
can be proved by applying two different principal approaches.
The first is rather “cultural” and “behavioral” backgrounded methodologies and tools
which are simply oriented in the description of characteristics of the main ethnic foods
consumed by different nations and in parallel with reports available for their populations’
diseases and mortality rates registered by the FAO and other relevant authorities. Another
way and in our opinion much accurate, and is based on strong analytical examination of
traditional food nutrient value data, main food ingredients, the presence of beneficial bio-
logical active compounds (BACs), and all the detected compositional elements from one
side, and causal relationships with mortality and diet-relevant disease rates from the otherside.
One of the region’s most typical food- and nutrition-relevant diseases is obesity.
Overweight and obesity are defined as abnormal or excessive fat accumulation that pre-
sents a risk to health. A crude population measure of obesity is the body mass index
(BMI), a person’s weight (in kilograms) divided by the square of his or her height (in me-
ters). A person with a BMI of 30 or more is generally considered obese. A person with a
BMI equal to or more than 25 is considered overweight. Overweight and obesity are
major risk factors for a number of chronic diseases, including diabetes, cardiovascular
diseases, and cancer.
To begin with, in the first approach, comparable and not analytic estimation and
description of the declared connection between these two groups of parameters (cuisines
in terms of “nutrition” and “rate diseases” level provided below for all of the selected in
countries). The population of Belarus in recent years has not changed significantly

(Fig. 9.1). The women/men ratio has also not changed recently and varied between 1 to
1.15 in 2019. As for urban and rural populations, there has been a tendency for the rural
population to decrease since 2019, and now it is about 21.6% of the population.
Concerning the morbidity of diseases of the digestive system among the adult popu-
lation of the Republic of Belarus for 2007e16, both general and primary morbidity are
observed in Minsk and the Gomel region. The most favorable situation is observed in the
Vitebsk and Mogilev regions. As for 2018, the highest mortality is in the Minsk region,
and the lowest in the Mogilev region. The downward trend in morbidity is characteristic
not only of the country but also for most regions (Mantivoda and Sineleva, 2019).
The main cause of mortality from 2012 to 2018 in Belarus was diseases of the circu-
latory system, while the lowest mortality was observed for diseases of the respiratory
system (Fig. 9.2) (Medvedeva, 2019).
The data for 2016 and 2017 demonstrate the differences related to food consumption
diseases measured for all the regions in Belarus introduced below (see Table 9.1).
In Belarus, 60%e65% of cases of type II diabetes occur in women (Public Health in
the Republic of Belarus, 2017). To connect these health issue data with Belarusian
cuisine one might note that “Belorussian” TF continued to maintain the closeness to
the cuisines of surrounding Slavic peoples, including Russians, Ukrainians, and Poles.
Also, these ethnic products are affected also by the influence of the cuisines of its
non-Slavic neighbors, such as the Lithuanians and Latvians. It is creating difficulties for

“distinguished” Belorussian dishes and such dishes are becoming less and less common in
the daily diet. First, the health and nutrition issues are correlated with the traditional use
of various types of “black flour”doatmeal, rye, barley, buckwheat and pea. The frequent
mixing of these various types and usage of rye flour for bread are also very typical in
Belarus.
Second, the predominant use of oatmeal and the ignorance of yeast has led to Belaru-
sian cuisine not actually recognizing either pancakes or pies is also one of its healthy habits
(Pokhlebkin, 2004).
The health issue or health influence of consumed foods is in the majority cases mainly
defined not by the components or ingredients themselves, but rather by the method of
cooking or food preparation techniques, traditional procedures, and preservation.
For example, Belarusian “pancakes” are completely different from Russian and
Ukrainian ones, since they are made from oat flour directly from raspda solution of flour
with waterdwhich spontaneously sours.
Several epidemiological studies have shown that the intake of whole-grain products is
associated with a reduced risk of type II diabetes, hypercholesterolemia, metabolic syn-
drome, and coronary heart disease, as well as cardiovascular mortality (Giacco et al., 2010;

Maki et al., 2010; Katcher et al., 2008). Empirical evidence shows that the consumption
of whole-wheat meals, like whole-grain bread, compared to white bread, even for 3 or
4 weeks, reduces total serum cholesterol level (Giacco et al., 2010), low-density lipids
(LDL) cholesterol, nonhigh-density lipids (non-HDL) cholesterol, triglyceride (Maki
et al., 2010), body fat, and abdominal obesity (Katcher et al., 2008; Liu et al., 2003).
This might be because of the high fiber content in this kind of bread. Furthermore, it
improved the bioavailability of vitamins and minerals, such as varieties of vitamin B,
calcium, and magnesium (Melanson et al., 2006).
Thus, it has greater diet quality and is attributed to a lower risk of cardiovascular dis-
ease (CVD). These facts make such products prepared without “yeast fermentation” a
relevant subject for health promotion.
This is important since self-fermented sourdough bread has been considered a healthy
food since ancient times. It is made using a sourdough starter composed of natural yeast
and lactobacilli (beneficial bacteria). Left to rise for 7e8 h and then baked, the bread con-
tains all the nutrients present in whole grains and, in particular, those in wheat germ. The
bread’s numerous beneficial effects are for the most part linked to two of its peculiar
characteristics: the sourdough starter and wheat germ (Capurso and Capurso, 2020).
This self-souring processing is commonly used in Belarus. Even when Belorussians
started using wheat flour at the time of the common Soviet Union history, they still
did not making it “yeast” fermented, instead applying soda as a baking powder.
The other products often consumed in Belorussia, Ukraine, and Russia as post-Soviet
countries are not differ significantly, so these cannot be calculated as factors in altered
population health.
Either typical vegetable-based dishes or pork or lamb meat are mainly used for cook-
ing homemade sausages, with similar procedures and preservation methods in all three
countries.
Even the differences detected in the consumption in Belorussia with a preference for
goose meat over chickens, which dominate in Ukrainian and Russian kitchens, could not
be reported or accepted as a crucial reason for any detected differences in food-relevant
health issues of the people from these countries.
The only significant effect on health can be recognized with food processing methods
or a large number of fermented foods that are consumed (Melini et al., 2019) and the
specific fermentation method.
Long-term and complex processing, which was used for grain or bran in folk cuisine
(including souring, malting, fermentation), caused such biochemical processes in these
simple products that greatly complicated their composition.
Thus, the main thing in traditional national Belarusian dishes in addition to special
combinations of flours for baked products that also differ from other countries is the pro-
cessing of ordinary and single products, which are subjected to complex, long, and often
combined cold and heat treatments that lead to a positive influence on human health.
Concerning the number of consumed products in Belarus there are illustrated in
Fig. 9.3 statistics for the changing ratios of consumed products from 2005 until 2019.

The increased amounts of meat, and fruits and berries, and decreased eating of bread and
bakery products with no changes for fish and only very slight reductions in milk and veg-
etables may be the reason for the relevant changes in the ratio of diet-dependent diseases.
Consumption of potatoes and meat per capita for Belarus (Table 9.2) (National
Statistical Portal, n.d.) was traditionallydas expecteddthe highest in the Commonwealth
of Independent States (CIS), when milk consumption was slightly lower than in
Kazakhstan, and egg consumption slightly lower than in Ukraine.
The general population of Estonia from 2000 to 2014 decreased, while from 2014 to
2020 it increased (Fig. 9.4). The women/men ratio increased from 1.13 in 2000 to 1.15
in 2020. Most of the population in Estonia is aged from 25 to 70 years.
Despite Estonia’s course to meet the global target for less low birth weight, there are
no sufficient data to assess Estonia’s progress for under-5 overweight, stunting, wasting,
and exclusive breastfeeding for infants. Estonia’s 2015 low birth weight prevalence of
4.3% has remained constant since 2000. Estonia’s adult population faces a malnutrition
issue: 25.6% of women of reproductive age have anemia, and 7.7% of adult men have
diabetes, compared to 6.5% of women. Meanwhile, 21.8% of women and 20.3% of
men are obese.
The mortality rate for the Estonian population and relevant statistics can be found in
Deaths (n.d.), where it is stated that at least half of deaths are caused by diseases of the
circulatory system that gradually increase with age and there is evidence of a clear
connection between nutrition and health (Fig. 9.5).


Coming to the issue of the Estonian cuisine, the most interesting feature is probably
the strange, untypical or almost indispensable combination of cooking components: milk
with peas and fish, potatoes as a component of a confectionery, making its unique uses
and technology of such unusual combinations that are unforgettable and extremely tasty
and healthy. There are no significant differences in the most typical food raw materials for
Estonian cuisine, and the vast majority of the foods are boiled rather than fried. Of course,
some Estonian dishes are fried, but they are not part of the national TF and are rarely
used, especially in comparison with the other EER countries, including Ukraine,
Belorussia, and Russia.
Another national characteristic of Estonian traditional foods’ processing is the very
small and specifically applied seasoning, such as onions, dill, marjoram, caraway, and
very rare parsley and celery.
The overwhelming majority of dishes are prepared completely without spices and
seasonings.
The strongly prescribed seasoning combination (dill in herring, marjoram in blood
sausages, cumin in cottage cheese, and parsley and celery in meat soups), with boiling
is accomplished with two traditional cooking approaches: (1) to use for boiling various
liquids in addition to water, for example kvass, milk, dairy-flour, dairy-sour cream,
and milkeegg mixture, and (2) not using any oil or butter for fried dishes (again only
milky-sour cream or a milky-flour concoction) have resulted in very healthy trends
and nutrition behavior.
This does not mean that Estonian cuisines are not tasty, since the variety of technol-
ogies used for boiled, semiboiled, semifried, and always semicooked with cream and sour
cream in its pure form, also the so-called “castmed”dmilk and milk-sour cream gravies
following the unusual and interesting combinations of products (fish with lard, apples
with bovine blood, peas with milk) allow for tremendous tasty and at the same time
healthy and unique TFs.
Estonian cooking traditions and the main ingredients potentially connected to con-
sumer health are relevant for the following national specificities, namely: (1) technologies
of using natural preservatives free from impurities, natural taste of food raw materials;
(2) huge variety of milk-containing dishes such as milk-dough, milk-cereals, milk-
vegetable, milk-fish, milk-mushroom, milk-egg, milk-beer, and even milk-milk soups,
prepared from unleavened milk contrast greatly with lactic acid soups of Central Asian
and Transcaucasian cuisines; (3) no seasoning, no fat, not fried, various unusual combi-
nations of boiling/mixing raw materials; (4) separate/single meat preparations and
consumption of meat mainly as a second dish; (5) mixed cereals, vegetable cereals, and
vegetable porridges, similar to Latvian putram, but somewhat different both in compo-
sition and in the absence of a fermentation process and in the strict constancy of their
combinations; (6) eating vegetables in pure form but not as separate dishes and obligatory
flavored with lard, butter, sour cream, and milk, as well as milk gravy but not with onion
Common nutrition and health issues in Eastern Europe 199
or dill; (7) potato retains pride of place as in Belorussia and Ukraine, but then cabbage and
peas are second, followed by carrots; (8) finally, among all the Baltic cuisines, and of
course the other EER countries described here, except probably Russia, Estonian
consumes the most fish. These specificities and ethnic food characteristics could be spec-
ulatively translated into their potential health effects: the first is relevant to lower con-
sumption of salty and fried products and different/specific methodologies of
preservation, namely no chemicals/antibiotic-based preservation that can negatively
affect human health; the second is connected to the consumption of milk-based dishes
which are dominant in the Estonian kitchen and which mainly replace the meat/
vegetable-based dishes which simplifies the digestion process, as is also true for points
(3) and (4) above; and the fifth specificity is difficult to interpret as “healthy” habits as
mixed components and no fermentation process is rather less beneficial compared to
eating fermented products, while the sixth point is in line with the principles of the
now widely known keto-diet that, in addition with point (8) proves the good influence
on the health of Estonian population, when the seventh point is rather neutral but only in
the case that the food basket has big variety.
The nutritional habits are connected not only to alimentary tract disease, as defined by
low safety and quality of consumed foods and drinks but also to the different so-called
metabolic diseases: from atherosclerosis via obesity and diabetes type II to cardiovascular
diseases.
Cardiovascular diseases (CVDs) contribute greatly to inequalities in health in Europe.
The CVD death rate in Ukraine is the highest in Europe and is sevenfold higher than in
France (which has the lowest). There is also a striking difference in CVD mortality
between European Union (EU) members before the enlargement in 2004 and Central
and Eastern European (CEE) countries that joined the EU in 2004 and non-EU coun-
tries. The difference in CVD mortality between West and East Europe grew during the
1970 and 1980s when rates declined in the West and either remained the same or rose in
the CEE countries. Political reforms at the beginning of the 1990s, which were followed
by great socioeconomic changes, coincided with further diversification in CVD mortality
in CEE countries. Diverse trends in CVD mortality were followed by larger gaps in life
expectancy between West and East Europe and within the CEE. Rapid development of
high-technology treatment procedures, which followed the economic recovery of the
CEE countries, would have only limited influence on the overall control of CVD. Expo-
sure to classic risk factors might largely explain the longitudinal trend in falling CVD
mortality in some countries, but it is unlikely that it could explain rapid changes in the
others. Still, large potential to control the disease lies in developing effective preventive
policies with targets to lower exposure to the classic CVD risk factors. The recent history
of CVD in CEE countries makes the “alcohol hypothesis” less convincing as an expla-
nation for CVD mortality trends and differences between East and West Europe. The
hypothesis that dynamic changes in CVD mortality in CEE countries are triggered
200 Nutritional and Health Aspects of Food in Eastern Europe
and explained largely by psychosocial factors is attractive. However, there is not enough
evidence for the last hypothesis (Pająk and Kozela, 2011). Similar research has been
conducted recently, and the tendencies of CVD developments/trends are reported.
Using the latest available data, CVD causes more than four million deaths each year
across Europe, accounting for 45% of all deaths. CHD and cerebrovascular disease were
the most common causes of CVD deaths, accounting for 1.8 million and 1.0 million
deaths, respectively. The number of deaths from CVD is higher in women (2.2 million)
than men (1.8 million), with CVD accounting for 49% of all deaths in women and 40%
of all deaths in men. With similar numbers of men and women dying from CHD, these
sex differences arise from a greater number of women dying from cerebrovascular disease
and “other cardiovascular diseases” (Fig. 9.6).
Poor-quality diets are high in refined grains and added sugars, salt, unhealthy fats, and
animal-source foods; and low in whole grains, fruits, vegetables, legumes, fish, and nuts.
They are often high in processed food productsdtypically packaged and often ready to
consumedand light on whole foods and freshly prepared dishes. These unhealthy diets
are facilitated by modern food environments, a problem that is likely to become more
widespread as food environments in low/medium-income countries shift to resemble
those of high-income countries (Anand et al., 2015).
According to recent studies (Stefler et al., 2020), nine food groups were identified
which were regularly consumed by rural communities in the 1950s/early 1960s in several
Eastern European countries. These were: (1) bread and grain products, (2) potatoes, (3)
legumes, (4) storable vegetables, (5) preserved fruits and vegetables, (6) dairy products and
egg, (7) poultry, (8) processed meat products, and (9) lard for cooking. Analyses of these
data illustrate that individuals who adhered closely to the traditional Eastern European
dietary pattern had higher risk of deaths from all-causes and from CVD compared to
those who did not follow such a diet. Therefore, traditional food should be studied
more and the overall dietary pattern should be considered.
The total population of Latvia (both males and females) is decreasing from 1990s. The
urban population is much larger than the rural one (Fig. 9.7), and the women/men ratio
increased from 2000 to 2012 and decreased from 2012 to 2019 (Central Statistical
Bureau, 2019).
In 2017, 42.7% of the Latvian population aged 16 and over had suffered from a long-
standing (lasting for more than 6 months) illness or health problem.
In 2016, the male obesity prevalence for Latvia was 21.6%. This parameter in Latvia
increased from 14% in 1997 to 21.6% in 2016, growing at an average annual rate of
2.31%. In 2016, the female obesity prevalence for Latvia was 25.1%. Between 1997 and
2016, the female obesity prevalence of Latvia grew substantially from 22.3% to 25.1%,
rising at an increasing annual rate that reached a maximum of 0.88% in 2003 and then
decreased to 0.80% in 2016. Once considered a problem only in high-income countries,

overweight and obesity are now dramatically on the rise in low- and middle-income
countries, particularly in urban settings (Latvia Male Obesity, 2020).
Although the life expectancy of the Latvian population has increased significantly
since 2000, it remains the lowest in the EU (Fig. 9.8), and major disparities persist by
gender and socioeconomic status.

The life expectancy for Latvia in 2020 was 75.32 years, a 0.18% increase from 2019.
Poor health outcomes are largely a product of the prevalence of unhealthy behaviors that
are very similar to Ukraine, as well as low levels of health spending.
The health system is underfunded and, despite recent progress, remains excessively
hospital-centric. The health status of the population could be improved by reducing
out-of-pocket payments and shifting the focus to prevention, primary care, home
care, and community-based services (OECD, 2017). Lifestyle-related risk factors account
for half of all deaths in Latvia. In 2014, one in four adults smoked dailyddown from one
in three in 2000, but still well above the EU average. The total figure masks a large
gender difference, with 37% of men reporting smoking daily in 2014. In the same
year, one in five Latvians reported engaging in heavy alcohol consumption regularlyda
proportion close to the EU average. The obesity rate was the second highest in the EU in
2017, with more than one in five Latvians being obese (Tisenkopfs et al., 2015). General
statistics of the healthcare system and dynamics of diseases in Latvia could be found at
Data Catalog (Health, 2020).
A very interesting report by The Diversity of Effects of EU Membership on Agricul-
ture in the New Member States claims that similarly to the majority of European coun-
tries, many countries lost some of their agricultural areas after EU accession. Latvia and
Lithuania, however, increased their utilized agricultural area (UAA) between 2003 and
2007. Agricultural employment in new member states (NMS) continued to fall after
EU accession also. For example, agricultural employment in Bulgaria and Lithuania
decreased by close to 40%. The decrease was more than 20% in Latvia. Capital as another
factor of production is usually measured in agriculture by the stock of assets per hectare of
agricultural land. There are huge differences among countries regarding asset endow-
ment. Countries with high agricultural production capacities (except Poland) lag behind
in asset endowment. In 2004, Slovenia had the greatest amount of asset endowment (total
assets/UAA), while the lowest was in Latvia (Slovenia had 16 times higher asset endow-
ment than Latvia in 2004) (Csaki and Jambor, 2009).
There is a very typical and very healthy tradition of Latvian people to eat a lot of salted
and pickled herring and smoked fish (eel, herring), as well as onions or scallions in their
natural form or included separately in a cuisine that is very similar to that of the Ukrai-
nians and Russians. Baltic herring contains omega-3 fatty acids and vitamin D, and has a
beneficial impact on cardiovascular diseases, mortality, and the risk of depression (Tuo-
misto et al., 2020). Onions are rich in flavonoids and the alk(en)yl cysteine sulfoxides
which have benefits for human health, such as anticarcinogenic, antiplatelet, antithrom-
bic, and other properties (Griffiths et al., 2002).
In Eastern Latvia, caraway seeds are added to dairy dishes, following the example of
Lithuanian cuisine, which has antioxidant potential and overall quality of protein bread
(Sayed Ahmad et al., 2018). Lard, smoked meat and cold cuts are often used with
mustard. To sum up the taste range of Latvian cuisine, it can be considered as moderately
204 Nutritional and Health Aspects of Food in Eastern Europe
sour/salty (Pokhlebkin, 2004; Wikipedia contributors, 2020d). Grains are also widely
used, from porridges to baking patties. The most popular bread in Latvia is made from
rye. Potato is “the second bread” for Latvians and also for Ukrainians, thus it is often
used in main courses, soups, and even salads. All these indicates that the traditional
Latvian diet and dishes are healthy. The national survey data demonstrate an increase
in the consumption of fruit and milk, while there has been a drop in potato and fish con-
sumption by Latvians. From 2016, compared with previous years, changes may be
observed in the consumption of certain food products and this probably explains some
of the positive tendencies observed in health condition of Latvians since these dates. Still,
it is very difficult to be sure of a connection between the nutrition and health condition
issues based only on these registered changes. This interrelationship is rather controver-
sial, since consumption of some food products is reducing, which is partly because house-
holds choose to eat outside home or have changed their eating habits/diet. Consumption
of potatoes, sugar, fish, cabbage, butter, margarine, and vegetable fat have dropped, while
consumption of milk, pork, poultry, fruit, local garden fruit, and drupes have increased.
The decline in consumption of sugar and potatoes may be influenced by the increase
in consumer prices (11.8% and 10.0%, respectively), but also probably an increased
understanding of the nutritional impact on human health. Survey results show that in
2016 one household member on average consumed 47 L of milk, 14 kg of cheese and
curd, 31 kg of bread, 207 eggs, 19 kg of fresh pork, 12 kg of fresh poultry, 21 kg of
sausage products and smoked meat, 62 kg of potatoes, and 5 kg of fresh fish. In respect
to fruit, the greatest numbers per household member annually were recorded in
consumption of local garden fruit and drupes (21 kg), tropical fruit and berries (11 kg),
and citrus fruit (10 kg) (Central Statistical Bureau, 2018). This gives an overall image
of Latvian dietary habits, which are rather healthy, especially in regard to the consump-
tion of local fruits and drupes. These are sources of biologically active components, which
have a positive impact on health (Sanlier et al., 2019).
The total population of Lithuania decreased from 3 502 000 in 2000 to 2 760 000 in
2019 (Fig. 9.9). The urban population increased (to 67.68% of the population in 2018).
Lithuania is on course to meet the global target for low birth weight, but is off course
in meeting the targets for anemia in women of reproductive age, male diabetes, female
diabetes, male obesity, and female obesity. Lithuania has no prevalence data available for
under-5 overweight, stunting, or wasting. There are also insufficient data on exclusive
breastfeeding among infants. Lithuania’s 2015 low birth weight prevalence of 4.5% has
decreased slightly from 4.8% in 2000.
Lithuania’s adult population faces a malnutrition burden, and also 25.5% of women of
reproductive age have anemia, and 8.9% of adult men have diabetes, compared to 7.1% of
women. Meanwhile, 27.8% of women and 24.2% of men are obese (Lithuania Nutrition
Profile, n.d.). Lifestyle-related risk factors account for more than half of all deaths in
Lithuania. Alcohol consumption is higher than in the majority of EU countries. In

2014, one in five adults reported smoking on a daily basis, with a rate of over one in
three among men. Cardiovascular diseases are the leading cause of death, accounting
for nearly two in five deaths. More than half of people aged 65þ reported having
one or more chronic diseases. One-third of all deaths in 2017 were related to dietary
risks (including low fruit and vegetable intake, and high sugar and salt consumption),
which is nearly twice the EU average (32% Lithuania, 18% EU). Recently, people
with diabetes type II (T2DM) had an excess mortality risk, which was higher in women
than men (Linkeviciute-Ulinskiene et al., 2020). One of the possible and obvious
reasons for such a situation is the budget of the health system, which is smaller than
in other EU countries (OECD, 2019).
A 2013 survey on the dietary habits of Lithuanians showed that they tend to have an
unhealthy diet: not consuming enough fresh fruits and vegetables and an average intake
of fish that is lower than the recommended amount. Only 21.3% of the adult population
admits to taking dietary decisions according to health criteria. Price is the determining
factor that affects the choice of food (Commission of the European Union, 2015). Other
studies also showed that school-aged children have low intakes of fruits and vegetables,
which leads to high rates of CVD and cancer risks. Therefore, increases in the consump-
tion of fruits and vegetables should be promoted, along with a reduction in the intake of
less healthy choices, such as soft drinks and high-fat, high-sugar snack foods, by reducing
social inequalities in food consumption (Zaborskis et al., 2012).

The total population in Russia has not changed dramatically since 2000 and the
female/male ratio is also quite stabile (Fig. 9.10). The urban population increased from
73.2% to 74.6%.
The mortality rate in Russia significantly decreased recently (from 16.0 in 2000e05
to 12.7 in 2015e20 per 1000 population), especially for children under 5 (from 19.3 in
2000 to 5.8 in 2019, deaths per 1000 live births) (Country Profile, 2020).
However, the number of people who have some kind of disease increased every year
and in 2019 in total almost 3,476,000 people were ill, in contrast to 2,381,000 in 2000
(Federal State Statistic, n.d.). The largest number of diseases per year is diseases character-
ized by high blood pressure. Its frequency increased more than threefold compared to
2000 (Table 9.3).
According to recent research, the consumption of milk and dairy products (28.9%
lower than norm) vegetables, and cucurbits (23.6% lower than the norm) and fruits
(41% lower than the norm) is lower than the dietary intake levels, while consumption
of bread products is much more than the norm (117 kg at a norm of 96 kg), potatoes
(96 kg at a norm of 90 kg), and sugar (39 kg at a norm of 24 kg) (Kulikov and Minakov,
2019).
Russia’s food environment falls short in offering healthy choices at affordable prices.
The availability of vegetables and fruits is lowest in Russia compared to other countries in
the WHO European Region. Most Russians face nutritional problems linked to
unhealthy diets like other post-Soviet Union countries. Almost 60% of Russia’s adult


population is overweight, and more than one in four (26.5%) is obese. The prevalence of
overweight and obesity in Russia has been increasing over the past 3 decades. In adults, it
is higher among women, whereas in childhood, rates are higher among boys. Compared
to their Central and Eastern European counterparts, Russians have the highest mean en-
ergy intake, with total fat as the main source, mostly provided by monounsaturated fat.
Unhealthy diets create risk factors for various cardiovascular diseases, cancers, chronic dis-
eases such as diabetes and osteoporosis, and many more. Attributable to the Russian diet
that has remained high in unsaturated fat and salt, and low in fruit and vegetables, partic-
ularly outside harvest season, disorders of the circulatory system increased by 18%, endo-
crine disorders by 18%, and neoplasms by 16%. Overweight and unhealthy nutrition are
underlying risk factors for cardiovascular diseases and cancers, which together with in-
juries account for 78% of deaths in Russia (Lunze et al., 2015).
The North Caucasus region, as part of Russia, especially Chechnya, Ingushetia, and
North Ossetia, is in the grip of an ongoing humanitarian crisis marked by conflict and
poverty. The health system is unable to sufficiently meet the demands of the 1.5 million
people affected by the crisis, 50,000 of whom are internally displaced, 27,000 living in
temporary accommodation centers in Chechnya, and about 47,000 people are living
in temporary settlements in Ingushetia. The main health priorities in the North Caucasus
are maternal and child health, communicable and vaccine-preventable disease control,
tuberculosis control, sexually transmissible infections and HIV/AIDS control, rehabilita-
tion of health structures, mental health and psychosocial rehabilitation, and antipersonnel
mine victim supportd this strategy was reported by the WHO (WHO, 2006).
Nevertheless, Caucasian people are the longest living population in Russia and across
the entire world.
The Caucasus region is known for having many people who live to be 100 years and
more. One of the most well-known among this group was Magomed Labazanov, a resi-
dent of Dagestan, who died in 2012 at the age of 122.
While the average life expectancy of ethnic Russians is about 72 years, the Caucasian
republics (Ingushetia, Dagestan, Kabardino-Balkaria, etc.) have a much higher figure.
People in Ingushetia, for example, often live up to 80 years, according to official statistics
(2017). That is why it is worth learning their secrets on how to stay active and cheerful as
long as possible.
Included in the list of scientifically and practically proved dishes connected to such
longevity are a variety of fermented milk products specific to these regions (ayran, mat-
zoni, narine) accomplished with local honey, and cheesedsalted suluguni and adygei
cheese which are very often mixed with adjika, and leaves of mint and coriander. These
types of cheese are unique as starters and also as they contain only 20%e30% fat. The
main everyday dish is thick porridgedmamalygadwhich is prepared from corn flour
and is as common as bread. Oil or sour milk cheese can also be added to mamalyga.
Corn can be a dessert for adults and children, and churek is another dish made from
210 Nutritional and Health Aspects of Food in Eastern Europe
it, which is sweetened with honey or stuffed with cheese and walnuts. Corn has low
levels of the amino acid tryptophan. People in the Caucasus region enjoy mutton,
lamb, and beef, and khinkali is one of the festive dishes. This is a broth with lamb and
flatbread made from dough. Other traditional dishes include fried chicken and chicken
cooked on a spit, boiled chicken with adjika, and stew of fowl in nut sauce with herbs.
Caucasians eat a lot of vegetables, and prepare dishes from beans, kohlrabi leaves, beetroot
tops, and cabbage. Salads are often seasoned with adjika, walnuts, and greens (coriander,
dill, and parsley). Spicy food helps to normalize blood pressure, as well as improve the
blood circulation. Walnuts are also used frequently, and contain seven times more calo-
ries than beef and have proteins, fatty oils, carbohydrates, and amino acids that are neces-
sary for health. Many tourists take churchhela home from the Caucasus. This delicious
dessert is made from nuts, flour, and grape or pomegranate juice. Caucasians also eat hon-
ey, baklava (pastry of phyllo dough and nuts), halva, and sweet fruit more often than
processed desserts. Red wine is made by many Caucasian families, and some joke that
three glasses of red wine is an essential part of your daily diet for a longer life (taken
from “Russia beyond,” written by Maria Bunina; Bunina, 2020).
Coming back to published recently statistical data about overweight people depen-
dent on the geographical location, place of living, gender, age, etc. in different regions
of Russia, including North Ossetia (Alania) Republic (North Caucasus), and the situation
is similar in this region to St. Petersburg and not comparable with other regions of Russia
(Figs. 9.11 and 9.12) (Kontsevaya et al., 2019).
In Tatarstan, since 2010, when the latest All-Russian Population Census of the
population was performed, the number of centenarians has more than doubled.
At the beginning of 2019, 371 residents over 100 years old lived in the Republic of
Tatarstan: 83 men and 288 women. Moreover, in 2010, there were only 156 such elderly
residents in the region.
In addition, there has been a decrease in the gender disparity among long-living
Tatarstan residents, although it remains in accordance with general demographic patterns.
“If, according to the results of the 2010 census, men aged 100 years and older were
almost seven times less than the number of women in this category, then at the beginning
of 2019 this difference decreased markedlydup to 3.5 times” (TatarstanSTAT).
The new All-Russian Population Census was due to be held from 1 to 31 October,
2020, using digital technologies, however it was delayed to 2021. All collected data
were to be accumulated in the Big Data format, as previously reported by the IA
“Tatar-inform”. More details are available at: https://www.tatar-inform.ru/news/society/
01-12-2019/v-tatarstane-rastet-chislo-dolgozhiteley-preodolevshih-vekovoy-rubezh-569
7270.
From other (scientific) research-oriented data it was reported that the connection
between FTO gene polymorphism with carbohydrate metabolism disorders and the
risk of developing DM2 in the Republic of Tatarstan has been proved. The positive

correlation of the FTO gene A allele with early carbohydrate metabolism disorders was
revealed, which allows groups with increased risk for dysfunctions of carbohydrate meta-
bolism to be identified. Apparently, the A/T polymorphism of the FTO gene is mostly
associated with the secretory function of pancreatic beta cells (Valeeva et al., 2018).
In this and other reports/papers the situation in relation to type II diabetes and obesity
in Tatarstan has been investigated, as shown in Fig. 9.13 the type II diabetes/obesity
distribution in 75 regions of Russia is good evidence for the lowest incidences registered
for Tatarstan and North Caucasus.
This fact is clear evidence of different culture and food differences influencing human
health conditions (Dedov et al., 2017).
The food of modern Tatars, keeping the main traditions of Tatar cuisine, has under-
gone significant changes. In connection with the forced resettlement of the Tatars and
the associated loss of national culinary traditions, vegetables and fruit began to occupy
a more significant place, and the range of fish dishes expanded, with mushrooms,
tomatoes, and salt entering everyday life. Fruit and vegetables that were previously
considered exotic and made available through international trade have become more
common (Pokhlebkin, 2004; Tatar National Dishes, n.d.).
The total population of Ukraine has decreased since 2000 and is decreasing every year
(Fig. 9.14). The female/male ratio increased from 2000 to 2010 and then decreased to 1:
1.15. The population aged 10e24 has decreased, while those aged 55e59 has increased
(World Population Prospects, n.d.).
An interesting study was performed in Ukraine in 2000. At that time, 39% of men and
49% of women were overweight. Predictably, it was found that the risk of being over-
weight increased dramatically with age: about 47% of men and 60% of women were
overweight in the 40þ age groups. Among young men (under 40), those consuming
more fruit (OR 1⁄4 0.31) and more physically active (OR 1⁄4 0.43) were less likely to be
overweight. In women over 60, those overweight were more physically active
(OR 1⁄4 2.32). In men over 40 and women below 40, the prevalence of overweight
was lower in smokers than nonsmokers. Eating potatoes, meat, and milk was associated
with increased BMI in some groups. No consistent associations were found for the con-
sumption of fish, butter, oil, sugar, and vegetables, or for education.
Thus, the authors made an interesting conclusion about the connection between spe-
cific traditional food consumption and obesity trends. They stated that being overweight
was more likely related to increased use of traditional foods like dairy products, meat, and
potatoes. Still, in the 2000s, the Ukrainian population did not bear patterns of obesity
epidemics found in the West, since no associations with either socioeconomic status or
foods usually associated with overweight were found. Smoking was related to lower
BMI in populations with a high prevalence of smoking (Chagarna and Andreeva, 2014).
The number of newly registered cases of diseases has a decreasing tendency
(Table 9.4), and the most common were the respiratory diseases. However, mortality
is relatively high, in 2018 more than 587,000 people died and the main cause of death
was CVD, killing more than 234,000 in 2018. Ischemic heart disease was the top cause


of death in 2017 (State Statistics Service of Ukraine, 2019). Dietary risks are also very
high. According to recent studies, food consumption in Ukraine should be changed
by increasing the consumption of meat and meat products, fish and fish products, fruits,
berries, and grapes (Batyr, 2019; Babych and Kovalenko, 2018).
Ukrainian cuisine is widely known among Slavic cuisines. It has long spread far beyond
the borders of Ukraine, and some Ukrainian dishes, such as borscht, varenyky, and
dumplings, have entered the menus of international cuisines and are generally healthy
TFs.
The favorite and most consumed product is lard, both as an independent dish, mainly
fried, in the form of so-called crackling, and in the form of a variety of spices and fatty
bases of a wide variety of dishes. Eating high-fat dishes in general is recognized as a
risk factor initiating CVDs, but there are some clinical trials demonstrating that frying
with lard is preferential as it has been proved to be safe (Talbot, 2011).
An abundance of flour products is very characteristic of Ukrainian cuisine. The
national dishes are products made from simple yeast-free dough: dumplings, grechaniki,
varenyky, cakes, and newer confectionery products, such as verguns and stavbits. The
wheat flour is almost exclusively used for these cookies. Vegetables are mainly used as

side dishes for fatty meat foods or served as independent dishes with bacon. Ukrainian
cuisine is also characterized by the use of different varieties of legumes and especially
beansdthis is one of the healthier habits. Preferred vegetable and plant crops include
beets, carrots, cabbage, pumpkin, corn, potatoes, and onions. Corn, like beans, is
more often used as an additive.
Of the spices and seasonings, the most popular are onions, garlic, dill, cumin, anise,
mint, lovage, angelica, savory, and red pepper, and imported spices include bay leaf, black
pepper, and cinnamon (for sweet dishes). Of the fruits and berries loved in Ukraine,
soaked, fresh, dried, and smoked-dried, cherries, plums, pears, currants, watermelons,
apples, and raspberries can be considered as national favorites. Along with fruits, modern
Ukrainian cuisine uses abundant quantities of sugar and molasses, both in pure form and
in the form of components of uzvar, preserves, and especially jam and confectionery,
what can be rather unhealthy.
All these facts give us indications that traditional food in Ukraine is not very healthy,
and that often it has more fat then needed. Studies have also shown that there are special
aspects of eating behavior that permit assessment of children’s health state as early alimen-
tary disease, manifested in excessive body mass, a deficiency of essential vitamins, min-
erals, and food fibers, and functional disorders of digestion (Podrigalo et al., 2017).
Correspondingly, general nutrition value before 1990/1992 was calculated based on
so-called nutritional tables. Western researchers have paid considerable attention to the
economic and political issues associated with the imbalances between the supply of
and demand for livestock products and other quality foods in the Soviet Union. Over
the last 2 decades, growth of discriminatory income and the maintenance of low and
increasingly subsidized retail prices along with greater awareness of the wider availability
of a variety of foods in the West and in some Eastern European countries have increased
Soviet consumers demands for high-quality food. Also, the composition of the food sup-
ply has changed somewhat to reflect consumer preferences in the Soviet Union which
has not solved the economic problem of providing a food supply that matches consumer
preferences (Lane et al., 1987).
There is an interesting report based on a comparable study of the nutrient content of
the Soviet food supply in comparison with the US food supply that for the years from
1965 till 1981 included changes in per capita levels of calories and nutrients which is
no longer confidential and fully publicly available as a CIA report (CIA, 1999).
Another issue is that data provided was not always accurate for a number of different
reasons, some of which are listed below. “The problem with this is that sources who are
trying to do the same (USDA and FAO) get different results. FAO’s series looks like
USDA unadjusted series. But FAO’s series also look like Allen’s, and Allen’s are supposed
to take losses into account. So someone is making a mistake somewhere. We could
perhaps believe the official Soviet data rather than FAO’s. But according to FAO, the
GOSKOMSTAT surveys have two problems: one is that it oversamples lower income
households and that the coefficients used to convert food kg into calories are
15%e20% lower than FAO’s. They conclude that “with such large differences, it is
Common nutrition and health issues in Eastern Europe 217
difficult to say much about the level of caloric consumption with any confidence”. And
even if we took the official consumption data that supposedly would be accounting for
losses it is still far from the similar figure for US intake from USDA, so differences in
methodology must be present. Thus the conclusion is then that, based on the data above,
Soviet caloric intake was high enough to say Soviet citizens were reasonably well fed, in
terms of calories” (Ricon, 2016). There are large differences in various sources, for example,
in numbers provided by FAO data about Soviet Union food nutrition and those provided
by Soviet statistics. Correspondingly, it is very difficult to come to a common conclusion
about the eating preferences of those in the Soviet Union people, since this subject is very
complicated.
The first food composition tables were published at the end of the 19th century
(Colombani, 2011). Nowadays these are very complex instruments that include not
only tables stored in databases, but also many different additional IT instruments for oper-
ating such data and carrying out complex analysis. Some instruments, such as Foo-
dExplorer by EuroFIR, include many food composition databases (FCDB) and make
it easy to operate with all the data simultaneously.
Many new tools and improvements in food composition databases have been devel-
oped, such as LanguaL, which helps with a standardized description of food. LanguaL is
widely used in almost all food composition databases and is a de facto standard (Finglas
et al., 2014).
The nutritional and elemental composition of traditional Belarusian dishes is insuffi-
ciently studied. Based on FAO and EuroFIR data, no publicly available FCDBs have
been created for this country (Giertlova, 2018). There are isolated initiatives to create
appropriate tables for products, and in 2018 the number of registered products was
146. For traditional dishes, known “collection of technological maps of Belarusian
dishes” it regulates only the composition at the level of products for tables and features
of their preparation. For more detailed study of such conditions, commonly used direc-
tories (Kurgan and Gaiduk, 2017) are often used.
Estonia has developed a national FCDB, which has more than 3620 of the most com-
mon foods in its territory. The first version was created in the early 1990s, and since 2009,
due to active cooperation with EuroFIR, its structure has been improved. Currently, the
database contains data from 267 sources and is constantly updated. The last update took
place in June 2020. The database has a graphical interface and is available at: https://tka.
nutridata.ee/. The database contains data not only on energy values, but also on the full
composition of products, with a maximum of 60 nutrients.
A common database on the composition of Latvian food products has been devel-
oped, which includes more than 600 products, data on which are obtained from various
sources, including from producers. The database also contains a method of preparation of
the product and a list of raw materials that are especially useful for people with various
218 Nutritional and Health Aspects of Food in Eastern Europe
food intolerances or allergies. The generally accepted LanguaL approach is used to
describe the products in the database. Unfortunately, there is no available web interface
for the database, but such access is possible through third-party tools, such as
FoodExplorer from EuroFIR.
According to the literature data, a composite food database is available for Lithuania,
but it is not available online and the year of its creation is mentioned as 2002. It is stated
that it is available through FoodExplorer from EuroFIR, but there is no detailed infor-
mation about it.
A food composition database in Russia doesn’t exist according to the FAO and there
are only food composition tables, which were last updated in 1985. However, there is an
online resource, http://web.ion.ru/food/FD_tree_grid.aspx, where you can find infor-
mation about the chemical composition of common foods. There is no detailed informa-
tion about this database or when it was created and which data were used to create it.
Analytical and other data collected by national compilers for all the countries in
which food composition data available can be found at the FAO official website
(INFOODS, n.d.).
Despite the Eastern European region TFs being well investigated and known in general
(Food and Agriculture, 2007; Trichopoulou, 1992), and there being numerous data on
recipes and related historicalecultural descriptions (Trichopoulou and Lagiou, 1998; Naska
et al., 2006), nutrition and health claims of the chosen EE foods and drinks remain incom-
pletely studied and therefore they are the subjects of great interest.
Current (actual) data on Ukrainian and Russian TFs were partially characterized and
defined within the BaSeFood project based only on prioritized dishes belonged to six
different groups: cereals, vegetable, fruit- and oil-based TFs, herbs and spices, and finally
fermented products and low or nonalcoholic content beveragesdall of them plant-
originated foods or drinks and all of them being selected and prioritized additionally as
products with the “highest potential health claims value” (Naska et al., 2000; Prieto-
Ramos et al., 1996). This could be an excellent example of how the documentation
on traditional food and their health claims, and also composition data, should be prepared
and analyzed.
According to this, the documentation of the traditional character, in addition to the
EuroFIR definition (Serra-Majem et al., 1993), is a prerequisite for the food (TF) being
integrated into the national documented file within the BaSeFood project. The national
files are excel files containing information on the origination of the traditional foods, its
traditionality, consumption of the food or its wider food group, availability of composi-
tion data, and references supporting all the collated information.
Based on these and some additional informationdprovided below criteria, of course,
not all of the EE cuisines may be reported as cuisines with “healthy” properties. For such
statements many careful studies are needed.
Common nutrition and health issues in Eastern Europe 219
Evaluation criteria considered for the finalization of the list of valuable selected
ethnical foods with potential national nutrition value in the EER should be based on:
(1) health claims and nutrient profiling; (2) food biodiversity and food composition;
(3) target bioactive components with putative health effects; (4) technological/cooking
safety criteria; and (5) good marketing potential.
To identify the nutrition profile and beneficial health input on humans of all the
promising EER0 foods, at least the different biological active substances and fiber, vita-
mins, minerals, etc. need to be included.
Such examinations had been analytically performed and the national documentation
file includes TF foods of plant origin belonging to the above-mentioned TF categories
within BaSeFood: (1) cereal or cereal-based foods; (2) vegetable or vegetable-based
foods; (3) fruit or fruit-based foods; (4) oilseeds or oilseed products; (5) herbs, spices,
and aromatic plants; and (6) low or nonalcoholic fermented foods and beverages.
By default all the foods included in the files contain bioactive substances (Naska et al.,
2008).
The nutritional composition (water, ash, total protein, total fat, individual fatty acids,
total sugars, starch, and total dietary fiber) of traditional foods from Ukraine and Russia
in this project has been determined using a common approach with standardized and
harmonized procedures (Costa et al., 2013; Albuquerque et al., 2013).
From the five analyzed foods of the Russian Federation, four are mainly constituted by
water and one is only constituted by fat since it is oil. The buckwheat porridge crumby also
has a significant amount of carbohydrates and about 5% of total dietary fiber because it is
prepared from buckwheat. Regarding minerals, buckwheat porridge crumby was the food
with the highest mineral content from the analyzed foods for the Russian Federation. K
was also found in vegetable okroshka and watermelon juice. The only mineral quantified
in kvass southern was Na and none of the analyzed minerals were found in mustard oil.
From the traditional foods selected for the Russian Federation, mustard oil was the only
one with vitamin E (1.1 mg/100 g of edible portion) and watermelon juice with vitamin
C (2.26 mg/100 g of edible portion). Vitamin B2 was found in small amounts in three
Russian Federation foods (buckwheat porridge crumby, vegetable okroshka, and water-
melon juice) ranging from 0.03 to 0.08 mg/100 g of the edible portion.
Regarding Russian Federation traditional foods, total folate was only found in buck-
wheat porridge crumby, lycopene in watermelon juice, and a-carotene in vegetable
okroshka. However, b-carotene was found in vegetable okroshka (181 mg/100 g edible
portion) and watermelon juice (48.7 mg/100 g edible portion).
As for Ukraine, of the seven foods selected, one is mostly composed of fat, another is
primarily composed of carbohydrates, and the others are mostly composed of water.
Besides a high fat content, roasted sunflower seeds have also a high protein content
(20%) and a considerable total dietary fiber content (about 11%). This total dietary fiber
content was similar to sour rye bread (about 9%). Regarding minerals, the selected foods
for Ukraine were those that presented the highest mineral content. The major minerals
220 Nutritional and Health Aspects of Food in Eastern Europe
found in these traditional foods were Na, K, Ca, Mg, and P. Roasted sunflower seeds
showed higher values for K, Ca, Mg, and P. As for vitamins and carotenoids, trans-
carpathian green borsch and cottage cheese with dill and garlic were not analyzed
as they were lyophilized. The other four analyzed Ukrainian foods all presented
with vitamin E, and vitamin C was only found in roasted sunflower seeds
(1.78 mg/100 g of edible portion). The highest vitamin E value was found for uzvar
(6 mg/100 g of edible portion), which was the only Ukrainian food without total
folate. On the other hand, in this group, roasted sunflower seeds had the highest total
folate content (113 mg/100 g of edible portion). Ukrainian borsch and sauerkraut pre-
sented lycopene, a-carotene, and b-carotene, although Ukrainian borsch had much
higher levels of these carotenoids. Roasted sunflower seeds presented only lycopene
(29.6 mg/100 g of edible portion) and uzvar only b-carotene (62 mg/100 g of edible
portion) (Costa et al., 2012).
Other papers recently published about BAC in different foods, about their direct
influence on human health, and their connection with the quality of food ingredients.
The use of cornelian cherry is associated with the popular perception of health-
promoting properties: disinfectant, antidiarrhea, antiinflammatory, and vessel-
protectant, especially against hemorrhoids (D’Antuono et al., 2014). Another study
investigated the effects of plant extracts on cellular markers of endothelial function
(eNOS activation and expression and ET-1 secretion). Treatment of human umbilical
vein endothelial cells with persimmon extract significantly increased Akt and eNOS
phosphorylation and nitric oxide metabolites and significantly decreased secretion of
ET-1 to the media after 24 h compared with a vehicle control. These results suggest
that persimmon fruit contains bioactives that can improve endothelial function via acti-
vation of eNOS and reduction in ET-1 secretion, but that dill, kale, Sideritis, and nettle
do not (Danesi et al., 2013). There are also results that illustrate that bioactive-rich
extracts of kale and pomegranate that are consumed as traditional plant foods of Black
Sea area countries were effective in modulating platelet function (Konic-Ristic et al.,
2013).
Despite the presence of large databases containing biologically active substances in
plants and foods in general, such as ePlantLibra and PhenolExplorer (Neveu et al.,
2010; Plumb et al., 2016), data on their contents are incomplete.
Another attempt had been made to summarize all the other evidence of food and
health interrelationships in the Encyclopedia of Food and Health (Caballero et al., 2015).
It has been recently shown that high intakes of fruit and vegetables are associated with
a decrease in cardiovascular diseases via endothelial protection. Thus the most important
fruit/vegetables and bioactive compounds to prevent endothelial diseases are berries,
apples, virgin olive oil, tomatoes, soybeans, and polyphenols, carotenoids, and unsatu-
rated fatty acids, respectively. The bioactive compounds from fruit and vegetables
Common nutrition and health issues in Eastern Europe 221
provide endothelial protection through the following mechanisms: improved eNOS/
NO bioavailability, attenuates oxidative stress, inhibited NF-kB pathway, and decreased
cell adhesion molecules expression (Monsalve et al., 2017).
The reliable and high-quality food composition data presented in this study are a key
tool for future food consumption surveys. Information on food description, sampling
plan, sample handling, component identification, method specification, and value and
quality assessment was collected for the prioritized traditional foods, enabling the provi-
sion of documentation to support the inclusion of new data in the available national
FCDBs.
The use of a common methodology for the study of traditional foods enables the
other EER countries to further investigate their traditional foods. Moreover, a knowl-
edge base of traditional foods from any country contributes to promoting local biodiver-
sity, rural development, and sustainable diets by maintaining healthy dietary patterns
within local cultures (Trichopoulou et al., 2002).
Nutrition and well-being of traditional food in targeted Eastern
European countries (EER)
The nutrition and food perceptions of the EER population are somewhat controversial
topics. As was demonstrated recently, food consumption priorities determined as results
of comprehensive international questionnaires have national and cultural specificities, but
nonetheless taste and price dominate perceptions of value, not the nutritional or health
impact.
Dietary data for nutrition monitoring and surveillance can be derived from three main
sources: food balance sheets (FBS), household budget surveys (HBS), and specifically
designed individual nutrition surveys (INS). The Food and Agriculture Organization-
assembled FBS provides information on food supply at the population level. Household
budget surveys are systematically conducted by National Statistical Offices in country
representative population samples and aim at collecting, among others, data on food
availability at the household level. Individual-based surveys, when participants’ intakes
are recorded as accurately as possible, provide the best evidence on food consumption.
Being expensive and labor intensive, however, representative individual-based surveys
are regularly undertaken in only a limited number of countries, usually those with robust
economies and years of experience in the field.
Documenting and monitoring dietary patterns are among the prime contributions of
food sciences in the development of nutritional epidemiology, the formulation of dietary
recommendations and the planning of national food, nutrition, and agricultural policies.
Diet represents an unusually complex set of exposures that are strongly intercorrelated.
Early efforts have been focused on identifying the specific nutrients that may be responsible for effects on people’s health. Current data, however, suggest that apparently
favorable effects cannot be exclusively attributed to specific components and in several
instances these components may act synergistically. International comparisons of dietary
exposures have primarily been based on food rather than nutrient intake. The food data
used for international comparisons are often derived from: (a) food balance sheets (FBS),
providing information on food supply at the population level; (b) household budget sur-
veys (HBS), collecting data on food availability in the household; and (c) specifically
designed individual nutrition surveys (INS), providing information on the food intake
of free-living individuals, over a specified time period.
The FBS had been completed nationally, on the basis of the annual food production,
imports and exports, changes in stocks, and agricultural and industrial uses within a coun-
try, as well as losses during storage and transportation. When these have been taken into
account, the remaining quantities represent the commodities that can be assumed to have
been used for human consumption in the country. The per-person supply of food
commodities is obtained by dividing the respective quantity by the population partaking
of it. International comparisons based on the time series FBS data, in conjunction with
information from other sources, can help to ascertain trends in the food supply of one
country in comparison to others.
The households data in national surveys data are required for the exact analytical esti-
mation or prognoses about food influences on human health.
In the context of the Sustainable exploitation of bioactive components from the Black Sea
Area traditional foods (BaSeFood) project (http://www.basefood-fp7.eu/), food supply
data from FBS and food availability data from HBS were retrieved for the six participating
countries, with Ukraine and Russian Federation among them, in order to describe
dietary patterns in the region. This dietary information is jointly described below with
mortality patterns, using data retrieved from the World Health Organization databases.
Household budget surveys provide information on foods and beverages available for
consumption to a nationally representative sample of households. The members of the
participating households are asked to record information on all foods and beverages avail-
able in the household during a reference period, including purchases, contributions from
own production, and food items offered to members as gifts. The survey is implemented
over a period of a year, with due attention to capturing seasonal variations in food intake.
Information on the demographic and socioeconomic characteristics of the household
members is also recorded, allowing analyses of the effect of socioeconomic determinants
on food choices.
Introduction to the food balance data of targeted EER
According to the WHO, almost 41 million people died of noncommunicable diseases in
2016, which is equivalent to almost 71% of all deaths (World Health Organization,
Common nutrition and health issues in Eastern Europe 223
2020). The major causes were: cardiovascular diseases (17.9 million deaths), cancer (9.0
million deaths), chronic respiratory diseases (3.8 million deaths), and diabetes (1.6 million
deaths). Cardiovascular disease and diabetes are related with lifestyle, particularly with
food intake patterns, with respect to the quantity and variety of foodstuffs.
The following countries were considered in this study: Tatarstan, North Caucasus,
Russian Federation, Ukraine, Belorussia, and also the Baltic countries.
Food balance sheets (FBS) from the Food and Agriculture Organization of the United
Nations (FAO) were the primary source of information for the present comparison
(INFOODS, n.d.).
Generally, the results for 2017 indicate relatively high standardized death rates among
the elderly for circulatory diseases among Eastern and Baltic member states; note, how-
ever, that the latest rates for Austria and Germany were also above the EU-27 average for
2016.
In Hungary, Latvia, Lithuania, and Romania, the standardized death rate among the
elderly for circulatory diseases was more than double the EU-27 average for 2016 (this
was also the case in Serbia), while it was nearly three times as high in Bulgaria.
This can be contrasted with the situation in France where the standardized death rate
among the elderly for circulatory diseases in 2016 was close to half (53.2%) the EU-27
average for 2016 (Causes of death statistics, n.d.; Table 9.5).
A general comparison among selected EEC was carried out with respect to the pat-
terns of: national food supply; and energy supply and nutrient supply, including protein
and fat for selected periods of time. Afterward, time trends for food, energy, and nutrients
supply for individual countries were compared. Then, a general comparison of all coun-
tries at chosen periods of time was performed. Finally, the groups with a larger food
supply, together with alcoholic beverages, were analyzed in more detail.
To carry out the comparison, foods were categorized in 11 groups (cereals; pulses, tree
nuts, and oil crops; animal fats; milk and eggs; starchy roots; fruits and vegetables; meat
and offal; vegetable oils; fish and seafood; sweeteners; and others (including alcoholic
beverages)dsimilar to the BaSeFood project.
These groups are in line with those used in the report “Nutrition Country Profile ”
prepared by the Food and Nutrition Division (FAO, INFOODS n.d.). The group of
fruits and vegetables does not include wine and the group of cereals does not include
beer. Wine and beer are included in the group called “others” as other alcoholic
beverages.
Initially, three time periods were selected (1991, 1992, and 2000) in order to compare
the evolution through three consecutive decades. Then, a final period was added, 2020,
which corresponds to the most recent data available. With respect to all targeted regions
in this edition data were only available from 1991/1992 forward.
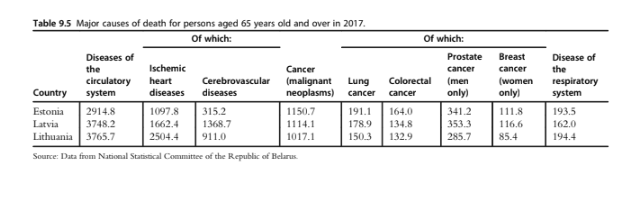
Conclusion
The data provided in this chapter raise many points for further investigation and discus-
sion. The first issue concerns the observation of decreased or increased mortality in exam-
ined EERdis any evidence available for food-relevant dependence and/or connected to
traditional foods’ consumption?
Do all the chosen EER already perform or at least plan to perform national surveysd
otherwise the consumption of traditional food preferences and national nutrition “pyr-
amids” are missing for these countries.
How could we try to exploit the food frequency questionnaire (FFQ) to estimate the
number of diseases associated with human metabolism in order to demonstrate the
dependency between recipes of traditional dishesdtoo fatty too salty, or fried .. ?
Would be it possible to use TF as a prototype for the future healthy food? Or on the
contrary, can we state or do we have enough evidence to declare that traditional dishes
are most useful since there is no harmful effect because they are not fried but fermented
and naturally preserved?
Or, perhaps, the recipe is fantastic and healthy at the same time, but the cultivation of
edible plantsdfood ingredients, for exampleddoes not meet the requirements, since
GMO modified, not primitive seeds and “new” edible plant varieties are used, which
differ in composition, minerals, vitamins, fibers, or they are the same but the cooking
technologies are adjusted using new technologies? How this is connected with actual
population health?
Is it possible that there is an elements imbalance in our health since the increased
“caloric” content of food because growth factors and antibiotics are widely used and un-
controlled, leading to the food quality not meeting modern requirements and in addition
its connection to reduced activity due to a sedentary lifestyle?
Whether and how the climate changes or increases in pollutants, crop yields, and/or
dramatic changes to soil, water, and air microbiomes, that are dominating players in the
environment, finally lead to human chronic infections?
Should we pay more attention to violations not of recipes, food compositions, analyt-
ical data, but rather to food traditions, by which we can enable and support slow food
consumption, promote eating with the family, cooking at home, to enable physical
and mental health?
Thus, probably, we need to recognize that healthy populations are those nations who
perceive and eat traditional foods as the most preferred food.
Finally, we come to what is known and accepted already: that we are what we eat and
our original foods with national brands, trends, and culture are a most valuable aSSET.
We need to act globally, while developing a strategy of TF preservation and recognition
as a national asset, and think about the sustainability, security, and protection of our
inherited nutrition and traditions.
226 Nutritional and Health Aspects of Food in Eastern Europe
References
Albuquerque, T.G., Costa, H.S., Sanches-Silva, A., Santos, M., Trichopoulou, A., D’Antuono, F.,
Alexieva, I., Boyko, N., Costea, C., Fedosova, K., Karpenko, D., Kilasonia, Z., Koçaoglu, B.,
Finglas, P., 2013. Traditional foods from the Black Sea region as a potential source of minerals. J. Sci.
Food Agric. 93 (14), 3535e3544. https://doi.org/10.1002/jsfa.6164.
Anand, S.S., Hawkes, C., De Souza, R.J., Mente, A., Dehghan, M., Nugent, R., et al., 2015. Food con-
sumption and its impact on cardiovascular disease: importance of solutions focused on the globalized
food system: a report from the workshop convened by the World Heart Federation. J. Am. Coll.
Cardiol. 66 (14), 1590e1614.
Babych, M., Kovalenko, A., 2018. Food security indicators in Ukraine: current state and trends of
development. Baltic J. Econom. Stud. 4 (1), 8e15. https://doi.org/10.30525/2256-0742/2018-4-1-
8-15.
Batyr, Y.H., 2019. Food security as a component of national security of Ukraine. East J. Secur. Stud. 4 (2019)
Bunina, M., 2020. Caucasian Secrets of Longevity: What to Eat if You Want to Live to 100!. Retrieved 3
October 2020, from. https://www.rbth.com/russian-kitchen/328843-caucasian-secrets-longevity-
food.
Caballero, B., Finglas, P., Toldra, F., 2015. Encyclopedia of Food and Health. Elsevier Gezondheidszorg.
Capurso, A., Capurso, C., 2020. The Mediterranean Way: Why Elderly People Should Eat Wholewheat
Sourdough BreaddA Little Known Component of the Mediterranean Diet and Healthy Food for
Elderly Adults.
Causes of death statistics - people over 65 - Statistics Explained. (n.d.). Retrieved October 12, 2020, from
ple_over_65&oldid1⁄4493747.
Central Statistical Bureau of Latvia, 2018. Latvia. Statistics in Brief 2018. Central Statistical Bureau of Latvia.
Central Statistical Bureau of Latvia, 2019. Latvia. Statistics in Brief 2019. Central Statistical Bureau of Latvia.
Chagarna, N.S., Andreeva, T.I., 2014. Lifestyle correlates of overweight and obesity among the population
of Ukraine. Tobac. Contr. Publ. Health E. Eur. 4 (1), 15e28. https://doi.org/10.6084/
m9.figshare.1060345.
CIA, 1999. The Nutrient Content of the Soviet Food Supply. Retrieved October 12, 2020, from. https://
Colombani, P.C., 2011. On the origins of food composition tables. J. Food Compos. Anal. 24 (4e5),
732e737.
Commission of the European Union, 2015. Directorate General for Employment, Social Affairs and
Inclusion. The Lithuanian food basket: Vilnius. Publications Office. https://doi.org/10.2767/375060.
Costa, H.S., Albuquerque, T.G., Sanches-Silva, A., Finglas, P., 2012. D 2.4. Final Report on the Evaluated
Dataset of the BSAC Traditional Foods Investigated.
Costa, H.S., Albuquerque, T.G., Sanches-Silva, A., Vasilopoulou, E., Trichopoulou, A., D’Antuono, L.F.,
Alexieva, I., Boyko, N., Costea, C., Fedosova, K., Hayran, O., Karpenko, D., Kilasonia, Z., Finglas, P.,
2013. New nutritional composition data on selected traditional foods consumed in Black Sea Area
countries. J. Sci. Food Agric. 93 (14), 3524e3534. https://doi.org/10.1002/jsfa.6192.
Costa, H.S., Vasilopoulou, E., Trichopoulou, A., Finglas, P., 2010. New nutritional data on traditional foods
for European food composition databases. Eur. J. Clin. Nutr. 64 (3), S73eS81.
Country Profile, February 6, 2020. UNICEF DATA. https://data.unicef.org/country/rus/.
Csaki, C., Jambor, A., 2009. The diversity of effects of EU membership on agriculture in New Member
States. Policy Stud. Rural Trans. 2009e4, 44.
D’Antuono, L.F., 2013. Traditional foods and food systems: a revision of concepts emerging from qualitative
surveys on-site in the Black Sea area and Italy. J. Sci. Food Agric. 93 (14), 3443e3454. https://doi.org/
10.1002/jsfa.6354.
D’Antuono, L.F., Bignami, C., 2012. Perception of typical Ukrainian foods among an Italian population.
Food Qual. Prefer. 25 (1), 1e8.
D’Antuono, L.F., Kolesnov, A., Fedosova, K., Jorjadze, M., Boyko, N., Mudryk, M., Bignami, C., 2014.
Cornelian cherry: an important local resource and promising health promoting fruit plant of the Black
Sea Area. Acta Hortic. 1017, 299e307. https://doi.org/10.17660/actahortic.2014.1017.37.
Common nutrition and health issues in Eastern Europe 227
Danesi, F., Saha, S., Kroon, P.A., Glibetic, M., Konic-Ristic, A., D’Antuono, L.F., Bordoni, A., 2013.
Bioactive-rich Sideritis scardica tea (mountain tea) is as potent as Camellia sinensis tea at inducing cellular
antioxidant defences and preventing oxidative stress. J. Sci. Food Agric. 93 (14), 3558e3564. https://
Deaths | Statistikaamet. (n.d.). Retrieved October 12, 2020, from https://www.stat.ee/en/find-statistics/
statistics-theme/population/deaths.
Dedov, I.I., Shestakova, M.V., Vikulova, O.K., 2017. Epidemiologiya sakharnogo diabeta v Rossiyskoy
Federatsii: kliniko-statisticheskiy analiz po dannym Federal’nogo registra sakharnogo diabeta [Epidemi-
ology of diabetes mellitus in the Russian Federation: clinical-statistical analysis according to the data of
Federal register of diabetes mellitus]. Sakharnyy DiabeteDiab. Mellitus 20 (1), 13e41.
Dilis, V., Vasilopoulou, E., Alexieva, I., Boyko, N., Bondrea, A., Fedosov, S., et al., 2013. Definition and
documentation of traditional foods of the Black Sea Area Countries: potential nutrition claims. J. Sci.
Food Agric. 93 (14), 3473e3477. https://doi.org/10.1002/jsfa.6238.
n.d. Federal State Statistic Service. (n.d.). Federal State Statistic Service. Retrieved October 12, 2020, from
Finglas, P.M., Berry, R., Astley, S., 2014. Assessing and improving the quality of food composition databases
for nutrition and health applications in Europe: the contribution of EuroFIR. Adv. Nutrit. 5 (5),
608Se614S. https://doi.org/10.3945/an.113.005470.
Food and Agriculture Organisation of the United Nations, 2007. Workshop on Supply Utilisation Accounts
and Food Balance Sheets. Food balance Sheets: History, Sources, Concepts and Definitions.
Giacco, R., Clemente, G., Cipriano, D., Luongo, D., Viscovo, D., Patti, L., et al., 2010. Effects of the regular
consumption of wholemeal wheat foods on cardiovascular risk factors in healthy people. Nutr. Metabol.
Cardiovasc. Dis. 20 (3), 186e194.
Giertlova, A., April 11, 2018. New analytical food composition data in Central Europe and Asia [Oral pre-
sentation]. In: EuroFIR Food Symposium 2018, Brussels, Belgium.
Griffiths, G., Trueman, L., Crowther, T., Thomas, B., Smith, B., 2002. Onionsda global benefit to health.
Phytother Res. 16 (7), 603e615.
Grigoriev, P., Shkolnikov, V., Andreev, E., Jasilionis, D., Jdanov, D., Mesle, F., Vallin, J., 2010. Mortality in
Belarus, Lithuania, and Russia: divergence in recent trends and possible explanations. Eur. J. Popul./
Revue Europeenne de Demographie 26 (3), 245e274. https://doi.org/10.1007/s10680-010-9210-1.
Guerrero, L., Guardia, M.D., Xicola, J., Verbeke, W., Vanhonacker, F., Zakowska-Biemans, S.,
Hersleth, M., 2009. Consumer-driven definition of traditional food products and innovation in tradi-
tional foods. A qualitative cross-cultural study. Appetite 52 (2), 345e354. https://doi.org/10.1016/
j.appet.2008.11.008.
Health Nutrition and Population Statistics | Data Catalog, October 8, 2020. The World Bank. https://
INFOODS: Europe. (n.d.). FAO. Retrieved October 12, 2020, from http://www.fao.org/infoods/infoods/
tables-and-databases/europe/en.
Katcher, H.I., Legro, R.S., Kunselman, A.R., Gillies, P.J., Demers, L.M., Bagshaw, D.M., Kris-
Etherton, P.M., 2008. The effects of a whole graineenriched hypocaloric diet on cardiovascular disease
risk factors in men and women with metabolic syndrome. Am. J. Clin. Nutr. 87 (1), 79e90.
Konic-Ristic, A., Srdic-Rajic, T., Kardum, N., Aleksic-Velickovic, V., Kroon, P.A., Hollands, W.J., et al.,
2013. Effects of bioactive-rich extracts of pomegranate, persimmon, nettle, dill, kale and Sideritis and
isolated bioactives on arachidonic acid induced markers of platelet activation and aggregation. J. Sci.
Food Agric. 93 (14), 3581e3587. https://doi.org/10.1002/jsfa.6328.
Kontsevaya, A., Shalnova, S., Deev, A., Breda, J., Jewell, J., Rakovac, I., et al., 2019. Overweight and obesity
in the Russian population: prevalence in adults and association with socioeconomic parameters and car-
diovascular risk factors. Obesity Fact. 12 (1), 103e114.
Kulikov, I.M., Minakov, I.A., 2019. Food security: problems and prospects in Russia. Sci. Pap.: Manage.,
Econom. Eng. Agric. Rural Develop. 19 (4).
Kurgan, Y.I., Gaiduk, A.R., 2017. Sovremennyy Vzglyad Na Pishchevuyu Tsennost’ Nekotorykh Tradit-
sionnykh Blyud Belorusskoy Natsional’noy Kukhni [A Modern Look at the Nutritional Value of Some
Traditional Dishes of the Belarusian National Cuisine].
228 Nutritional and Health Aspects of Food in Eastern Europe
Lane, A.M., Marston, R.M., Welsh, S.O., 1987. The nutrient content of the soviet food supply and com-
parisons with the US food supply. In: US Congress, Joint Economic Committee, vol. 2. Gorbachev’s
Economic Plans, pp. 79e99.
Latvia Male Obesity Prevalence, 1960-2018 - knoema.Com, October 8, 2020. Knoema. https://knoema.
com/atlas/Latvia/Male-obesity-prevalence.
Linkeviciute-Ulinskiene, D., Kaceniene, A., Dulskas, A., Patasius, A., Zabuliene, L., Smailyte, G., 2020.
Increased mortality risk in people with type 2 diabetes mellitus in Lithuania. Int. J. Environ. Res.
Publ. Health 17 (18), 6870. https://doi.org/10.3390/ijerph17186870.
Lithuania Nutrition Profile - Global Nutrition Report. (n.d.). Global Nutrition Report. Retrieved October
europe/lithuania/.
Liu, S., Willett, W.C., Manson, J.E., Hu, F.B., Rosner, B., Colditz, G., 2003. Relation between changes in
intakes of dietary fiber and grain products and changes in weight and development of obesity among
middle-aged women. Am. J. Clin. Nutr. 78 (5), 920e927.
Lunze, K., Yurasova, E., Idrisov, B., Gnatienko, N., Migliorini, L., 2015. Food security and nutrition in the
Russian Federation e a health policy analysis. Glob. Health Act. 8 (1), 27537. https://doi.org/10.3402/
gha.v8.27537.
Maki, K.C., Beiseigel, J.M., Jonnalagadda, S.S., Gugger, C.K., Reeves, M.S., Farmer, M.V., Kaden, V.N.,
Rains, T.M., 2010. Whole-grain ready-to-eat oat cereal, as part of a dietary program for weight loss,
reduces low-density lipoprotein cholesterol in adults with overweight and obesity more than a dietary
program including low-fiber control foods. J. Am. Diet Assoc. 110 (2), 205e214.
Mantivoda, V.E., Sineleva, M.V., 2019. Rasprostranennost’ Bolezney Organov Pishchevareniya Sredi Nase-
leniya Respubliki Belarus’ [The Prevalence of Diseases of the Digestive System Among the Population
of the Republic of Belarus.
Medvedeva, I., 2019. Demography Yearbook of the Republic of Belarus. National Statistical Committee of
the Republic of Belarus.
Melanson, K.J., Angelopoulos, T.J., Nguyen, V.T., Martini, M., Zukley, L., Lowndes, J., et al., 2006. Con-
sumption of whole-grain cereals during weight loss: effects on dietary quality, dietary fiber, magnesium,
vitamin B-6, and obesity. J. Am. Diet Assoc. 106 (9), 1380e1388.
Melini, F., Melini, V., Luziatelli, F., Ficca, A.G., Ruzzi, M., 2019. Health-promoting components in fer-
mented foods: an up-to-date systematic review. Nutrients 11 (5), 1189.
Monsalve, B., Concha-Meyer, A., Palomo, I., Fuentes, E., 2017. Mechanisms of endothelial protection by
natural bioactive compounds from fruit and vegetables. An Acad. Bras Ci^encias 89 (1), 615e633.
Naska, A., Fouskakis, D., Oikonomou, E., et al., 2006. Dietary patterns and their socio-demographic deter-
minants in ten European countries. Data from the DAFNE databank. Eur. J. Clin. Nutr. 60 (2),
181e190.
Naska, A., Vasdekis, V.G., Trichopoulou, A., et al., 2000. Fruit and vegetable availability among ten Euro-
pean countries: how does it compare with the “five-a-day” recommendation? Br. J. Nutr. 84 (4),
549e556.
Naska, A., Berg, M.A., Cuadrado, C., Freisling, H., Gedrich, K., Gregoric, M., et al., 2008. Food balance
sheet and household budget survey dietary data and mortality patterns in Europe. Br. J. Nutr. 102 (1),
166e171.
n.d National Statistical portal of the Republic of Belarus. (n.d.). Retrieved October 12, 2020, from https://
Neveu, V., Perez-Jimenez, J., Vos, F., Crespy, V., du Chaffaut, L., Mennen, L., Knox, C., Eisner, R.,
Cruz, J., Wishart, D., Scalbert, A., 2010. Phenol-Explorer: an online comprehensive database on poly-
phenol contents in foods. Database : J. Biol. Databases Curat. 2010, bap024. https://doi.org/10.1093/
database/bap024.
OECD/European Observatory on Health Systems and Policies, 2017. Latvia: Country Health Profile 2017,
State of Health in the EU. OECD Publishing, Paris/European Observatory on Health Systems and Pol-
icies, Brussels. https://doi.org/10.1787/9789264283466-en.
Common nutrition and health issues in Eastern Europe 229
OECD/European Observatory on Health Systems and Policies, 2019. Lithuania: Country Health Profile
2019, State of Health in the EU. OECD Publishing, Paris/European Observatory on Health Systems
and Policies, Brussels. https://doi.org/10.1787/35913deb-en.
Pająk, A., Kozela, M., 2011. Cardiovascular disease in central and east Europe. Publ. Health Rev. 33 (2),
416e435.
Plumb, J., Lyons, J., Nørby, K., Thomas, M., Nørby, E., Poms, R., Bucchini, L., Restani, P., Kiely, M.,
Finglas, P., Consortia, P.L.I.B.R.A., February 15, 2016. ePlantLIBRA: a composition and biological ac-
tivity database for bioactive compounds in plant food supplements. Food Chem. 193, 121e127. https://
doi.org/10.1016/j.foodchem.2015.03.126. Epub 2015 Apr 13. PMID: 26433297.
Podrigalo, L.V., Iermakov, S.S., Avdiievska, O.G., Rovnaya, O.A., Demochko, H.L., 2017. Special aspects
of Ukrainian schoolchildren’s eating behavior. Pedagogy Phys. Cul. Sports 3.
Pokhlebkin, V.V., 2004. Natsional’nyye Kukhni Nashikh Narodov [National Cuisines of Our Peoples].
Centerpolygraph, Moscow.
Prieto-Ramos, F., Serra-Majem, L., La Vecchia, C., Ramon, J.M., Tresserras, R., Salleras, L., 1996. Mor-
tality trends and past and current dietary factors of breast cancer in Spain. Eur. J. Epidemiol. 12 (2),
141e148.
Public Health in the Republic of Belarus, 2017. An Official Statistics Collection.
Ricon, J.L., May 11, 2016. Nintil - the Soviet Union: The Food Consumption Puzzle. Nintil. https://nintil.
com/the-soviet-union-food/.
Sanlier, N., Gökcen, B.B., Sezgin, A.C., 2019. Health benefits of fermented foods. Crit. Rev. Food Sci.
Nutr. 59 (3), 506e527.
Sayed Ahmad, B., Talou, T., Straumite, E., Sabovics, M., Kruma, Z., Saad, Z., et al., 2018. Protein bread
fortification with cumin and caraway seeds and by-product flour. Foods 7 (3), 28.
Serra-Majem, L., La, C.V., Ribas-Barba, L., Prieto-Ramos, F., Lucchini, F., Ramon, J.M., Salleras, L., 1993.
Changes in diet and mortality from selected cancers in southern Mediterranean countries, 1960-1989.
Eur. J. Clin. Nutr. 47, S25eS34.
Slimani, N., et al., 2007. The EPIC nutrient database project (ENDB): a first attempt to standardize nutrient
databases across the 10 European countries participating in the EPIC study. Eur. J. Clin. Nutr. 61 (9),
1037e1056.
State Statistics Service of Ukraine, 2019. Population of Ukraine. Demographic Yearbook.
Derzhanalitinform.
Stefler, Denes, et al., 2020. Traditional Eastern European diet and mortality: prospective evidence from the
HAPIEE study. Eur. J. Nutr. 1e10.
Talbot, G. (Ed.), 2011. Reducing Saturated Fats in Foods. Elsevier.
Tatar national dishes: Republic of Tatarstan. (n.d.). Republic of Tatarstan. Retrieved October 12, 2020,
from http://1997-2011.tatarstan.ru/index.html@node_id1⁄4977.html.
Tisenkopfs, T., Grõvin s, I., Sumane, S., 2015. National Report: Latvia. Food and Nutrition Security Debate.
FP7 Transmango project.
Townsend, N., Wilson, L., Bhatnagar, P., Wickramasinghe, K., Rayner, M., Nichols, M., 2016. Cardiovas-
cular disease in Europe: epidemiological update 2016. Eur. Heart J. 37 (42), 3232e3245. https://
Trichopoulou, A., 1992. Monitoring food intake in Europe: a food data bank based on household budget
surveys. Eur. J. Clin. Nutr. 46, S3eS8.
Trichopoulou, A., Lagiou, P., 1998. The DAFNE food data bank as a tool for monitoring food availability in
Europe. DAta Food NEtworking. Publ. Health Rev. 26 (1), 65e71.
Trichopoulou, A., Naska, A., Costacou, T., DAFNE III Group, 2002. Disparities in food habits across
Europe. Proc. Nutr. Soc. 61 (4), 553e558.
Tuomisto, J.T., Asikainen, A., Meril€ainen, P., Haapasaari, P., 2020. Health effects of nutrients and environ-
mental pollutants in Baltic herring and salmon: a quantitative benefit-risk assessment. BMC Public
Health 20 (1), 64.
Valeeva, F., Ahmetov, I., Kiseleva, T., Khasanova, K., Sozinova, E., Valeeva, E., May, 2018. Association of
the FTO gene rs9939609 polymorphism with carbohydrate metabolism disorders in the Republic of
Tatarstan. In: 20th European Congress of Endocrinology, vol. 56. BioScientifica.
230 Nutritional and Health Aspects of Food in Eastern Europe
Wikipedia contributors, May 18, 2020a. Soviet cuisine. Retrieved October 12, 2020, from. https://en.
Wikipedia contributors, October 8, 2020c. Caucasus. Retrieved October 12, 2020, from. https://en.
Wikipedia contributors, September 27, 2020d. Latvian Cuisine. Wikipedia. https://en.wikipedia.org/wiki/
Latvian_cuisine.
World Health Organization, 2006. Health Actions in Crisis. Retrieved October 12, 2020, from. https://
World Health Organization, 2020. World Health Statistics 2020: Monitoring Health for the SDGs Sustain-
able Development Goals. World Health Organization.
World Population Prospects - Population Division - United Nations. (n.d.). UN. Retrieved October 12,
2020, from https://population.un.org/wpp/.
Zaborskis, A., Lagunaite, R., Busha, R., Lubiene, J., 2012. Trend in eating habits among Lithuanian school-
aged children in context of social inequality: three cross-sectional surveys 2002, 2006 and 2010. BMC
Publ. Health 12 (1). https://doi.org/10.1186/1471-2458-12-52.


Коментарі